Fig. 11
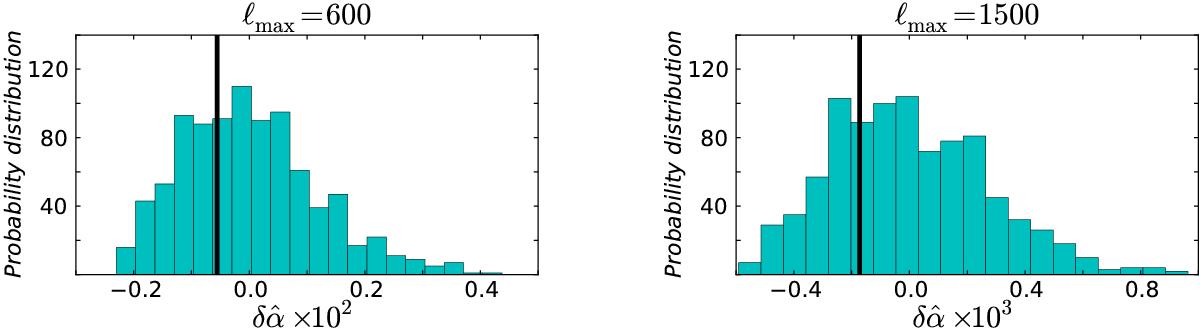
Histogram of the distribution of the overall amplitude of the dipole modulation for 900 unmodulated realizations. The distribution is not normalized. The histogram on the left corresponds to Planck-like simulated data without modulation with ℓmax = 600, while the one on the right os for ℓmax = 1500 . In each plot, the black line corresponds to the measurements in the actual Planck CMB map.
Current usage metrics show cumulative count of Article Views (full-text article views including HTML views, PDF and ePub downloads, according to the available data) and Abstracts Views on Vision4Press platform.
Data correspond to usage on the plateform after 2015. The current usage metrics is available 48-96 hours after online publication and is updated daily on week days.
Initial download of the metrics may take a while.