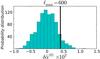
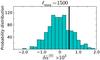
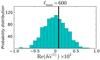
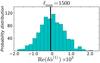
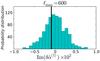
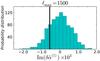
Fig. 10
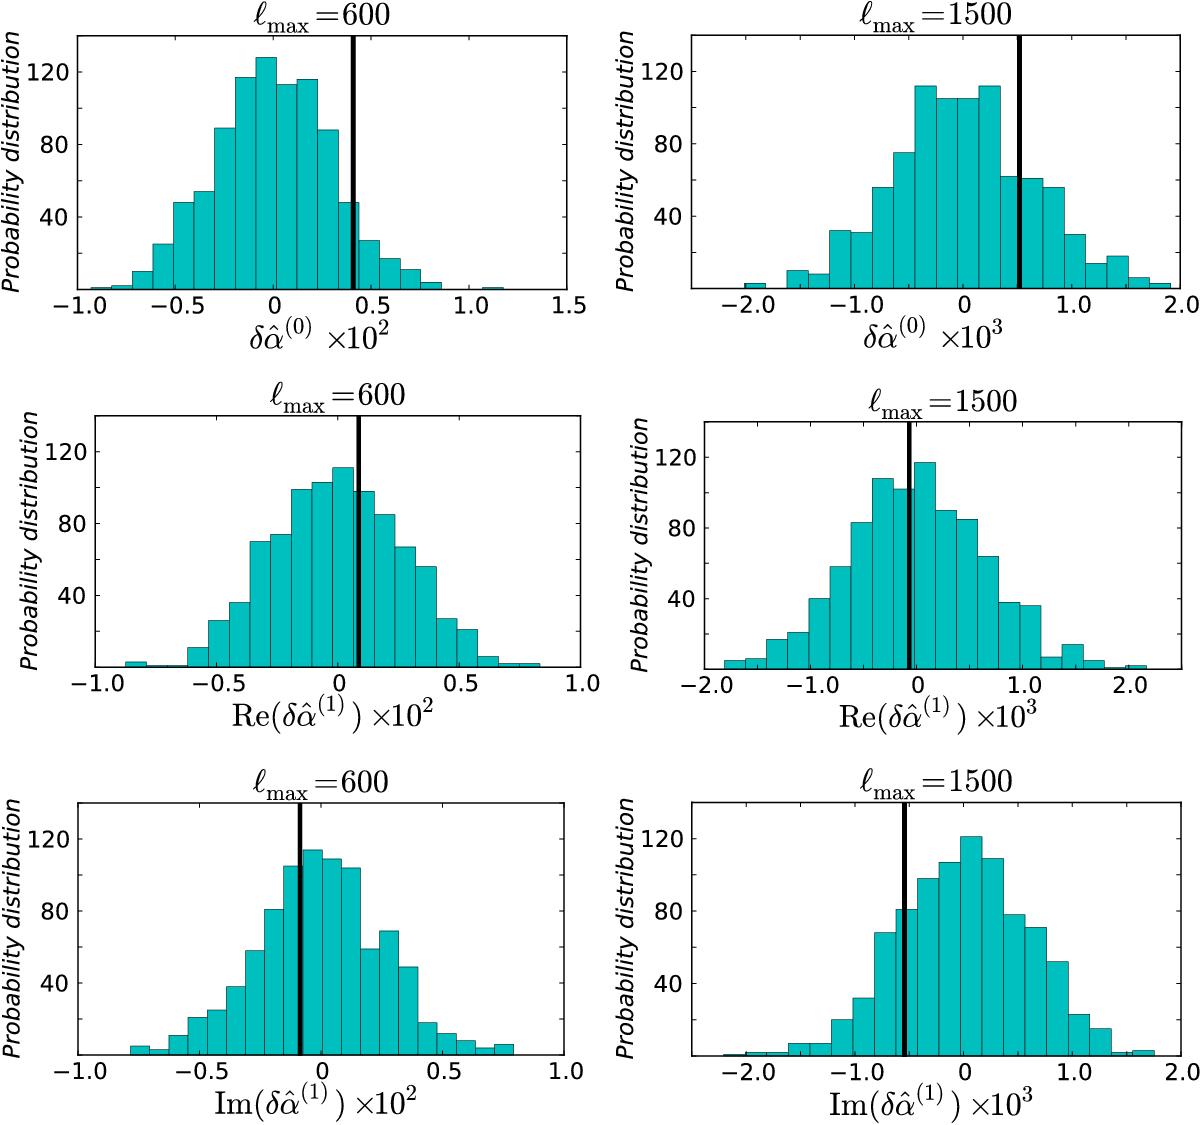
Left: histogram of the distribution of the components of the dipole modulation for 900 unmodulated realizations. The distribution is not normalized. From top to bottom we show δα(0), Re(δα(1)) and Im(δα(1)). The three histograms correspond to Planck-like modulation-free simulated data with ℓmax = 600. The black line corresponds to the measurements in the actual Planck CMB map. Right: the same thing for ℓmax = 1500.
Current usage metrics show cumulative count of Article Views (full-text article views including HTML views, PDF and ePub downloads, according to the available data) and Abstracts Views on Vision4Press platform.
Data correspond to usage on the plateform after 2015. The current usage metrics is available 48-96 hours after online publication and is updated daily on week days.
Initial download of the metrics may take a while.