Fig. 1
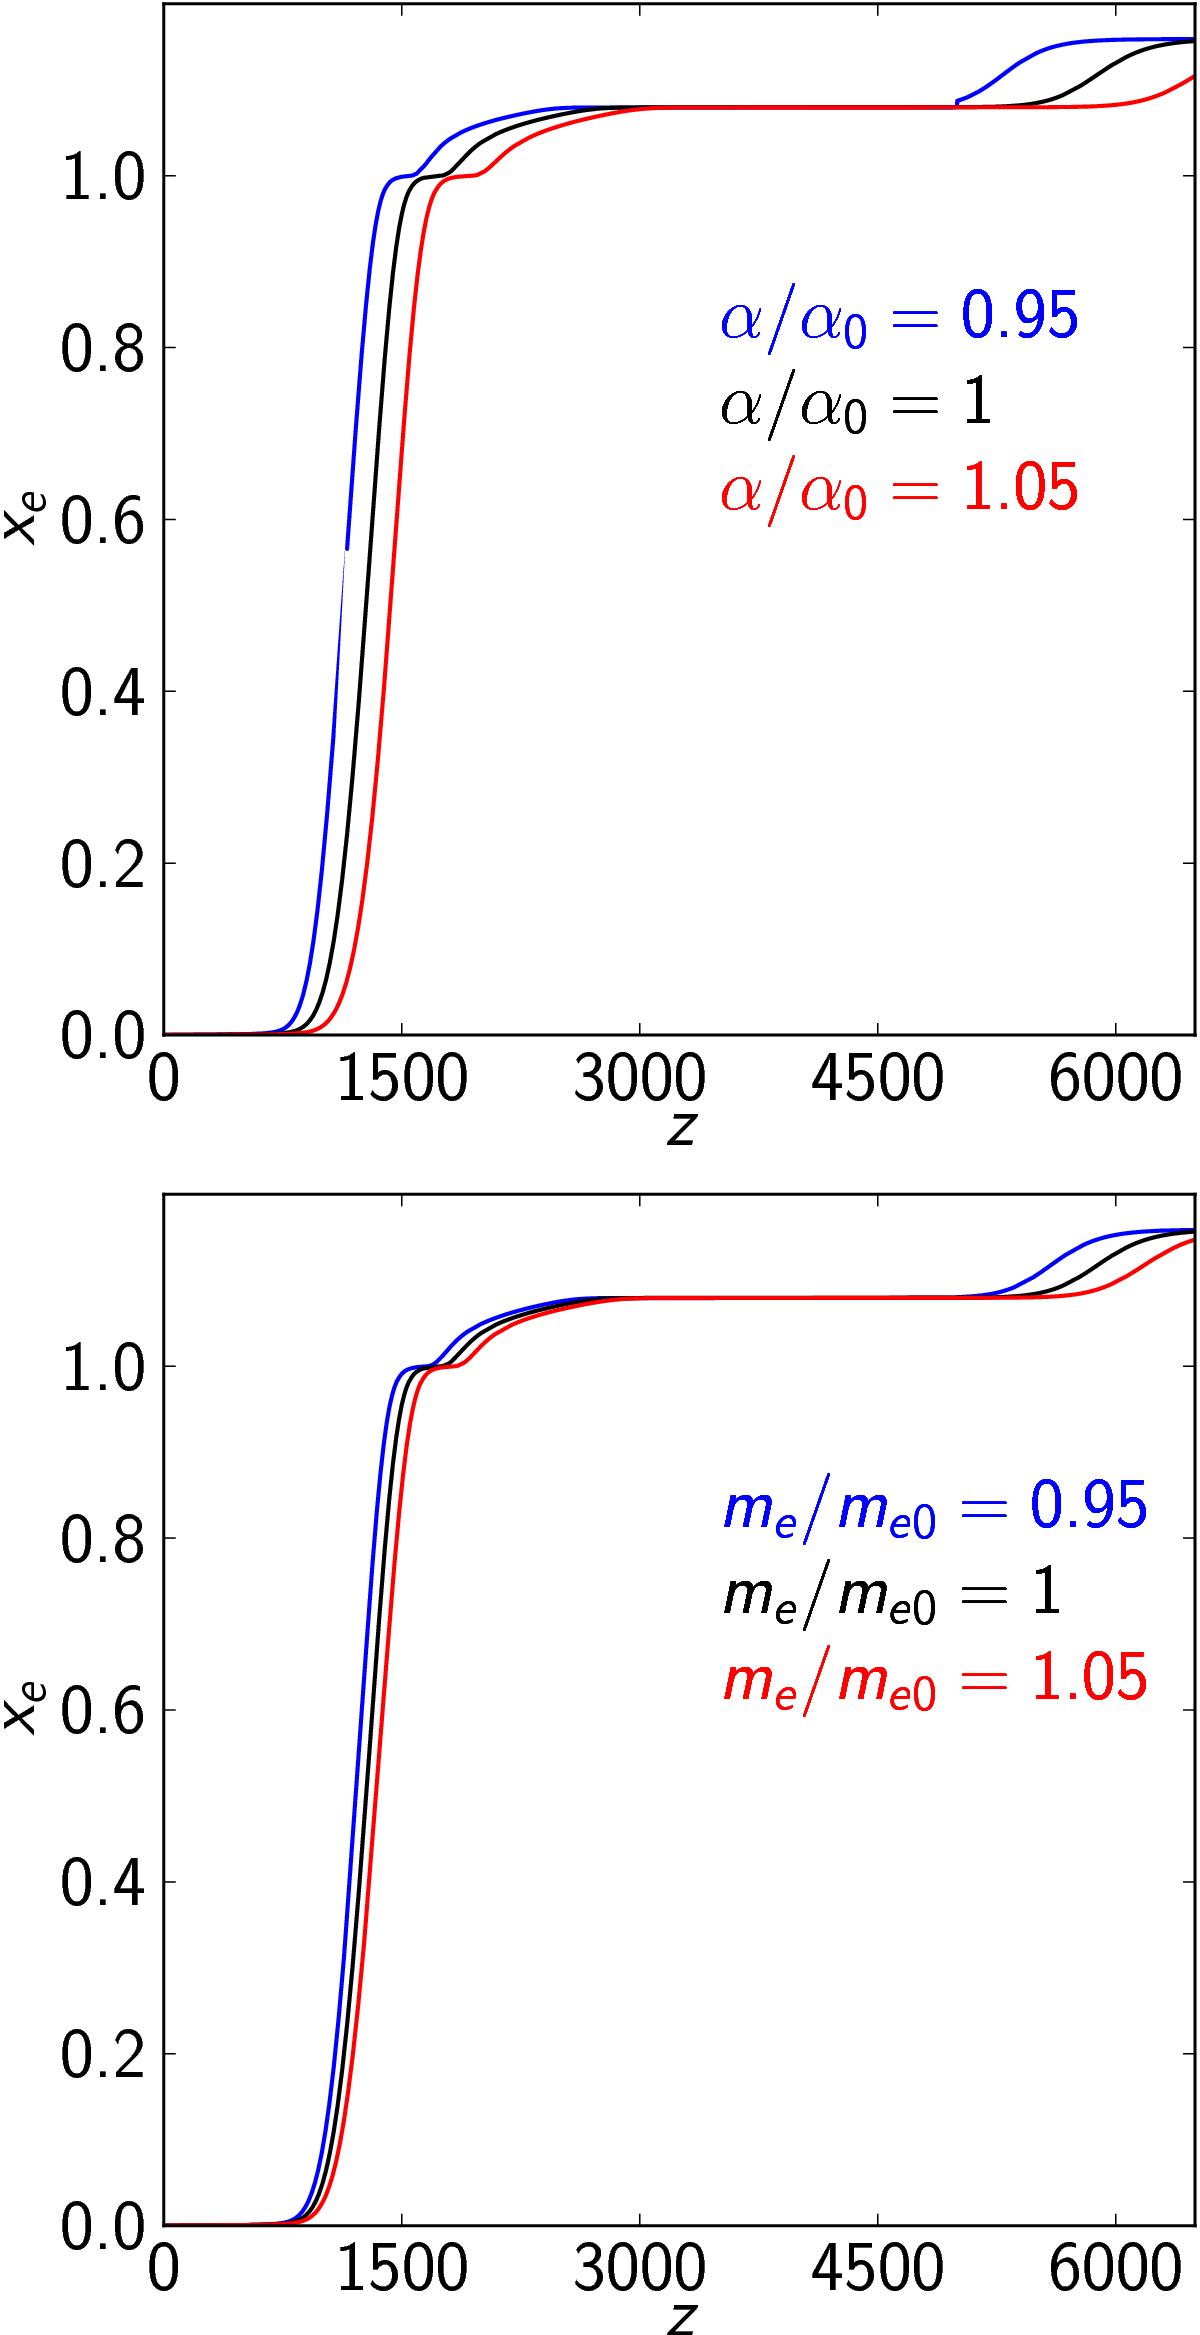
Evolution of the free electron fraction xe with redshift z for different values of the fine structure constant α (top) and of the mass of the electron (bottom). The coloured lines refer to a −5% (blue) and + 5% (red) variation of the constants, while the black line shows the standard case. The decreases at redshift around 6000 and 2000 correspond to the first and second recombination of helium, while the large decrease at redshift 1300 is due to the recombination of hydrogen.
Current usage metrics show cumulative count of Article Views (full-text article views including HTML views, PDF and ePub downloads, according to the available data) and Abstracts Views on Vision4Press platform.
Data correspond to usage on the plateform after 2015. The current usage metrics is available 48-96 hours after online publication and is updated daily on week days.
Initial download of the metrics may take a while.