Free Access
Fig. A.4
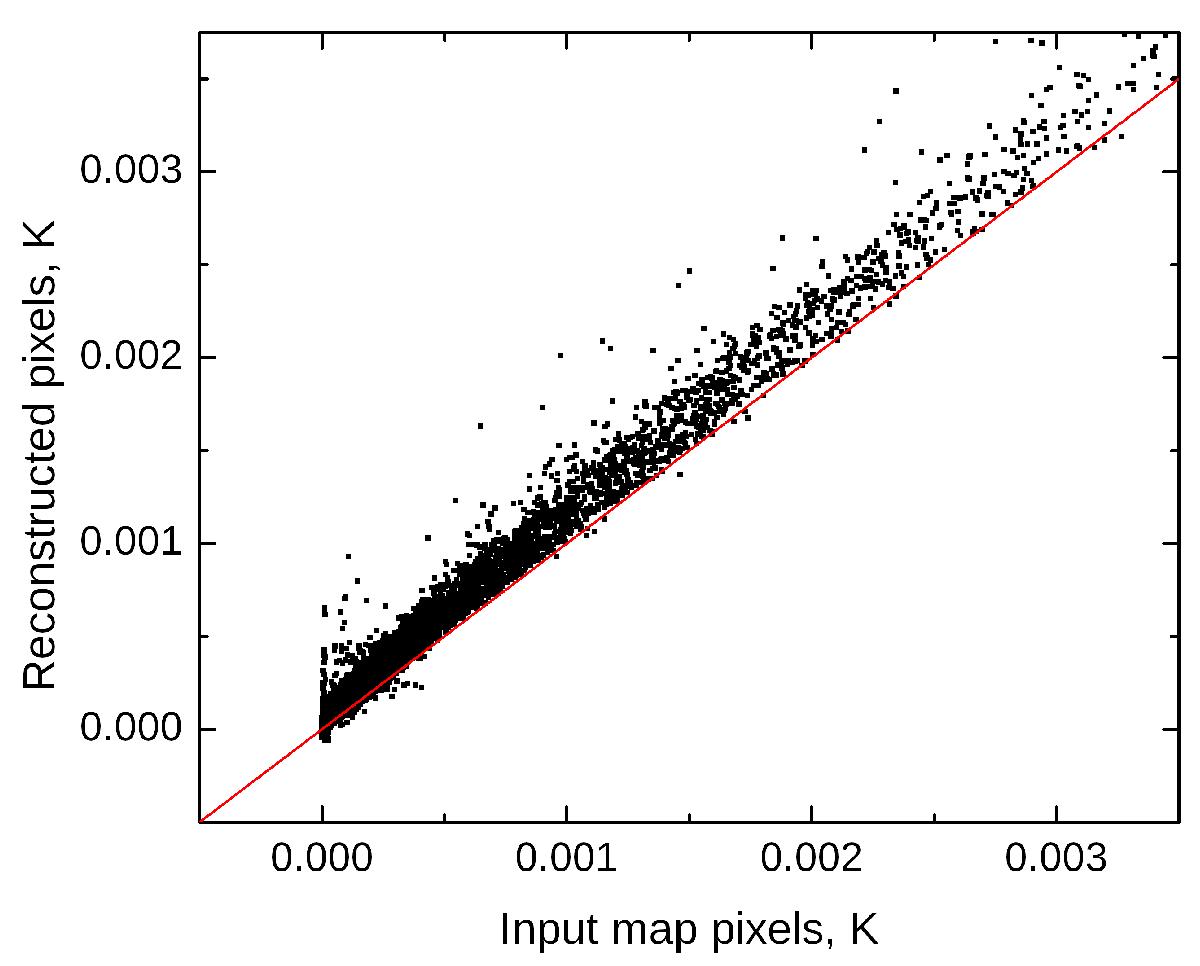
T–T plot comparing the pixel values in the simulated input map and in the reconstructed map. The solid red line indicates equality. The frequency is 70.4 GHz and the temperature scale is KCMB.
Current usage metrics show cumulative count of Article Views (full-text article views including HTML views, PDF and ePub downloads, according to the available data) and Abstracts Views on Vision4Press platform.
Data correspond to usage on the plateform after 2015. The current usage metrics is available 48-96 hours after online publication and is updated daily on week days.
Initial download of the metrics may take a while.