Fig. 7
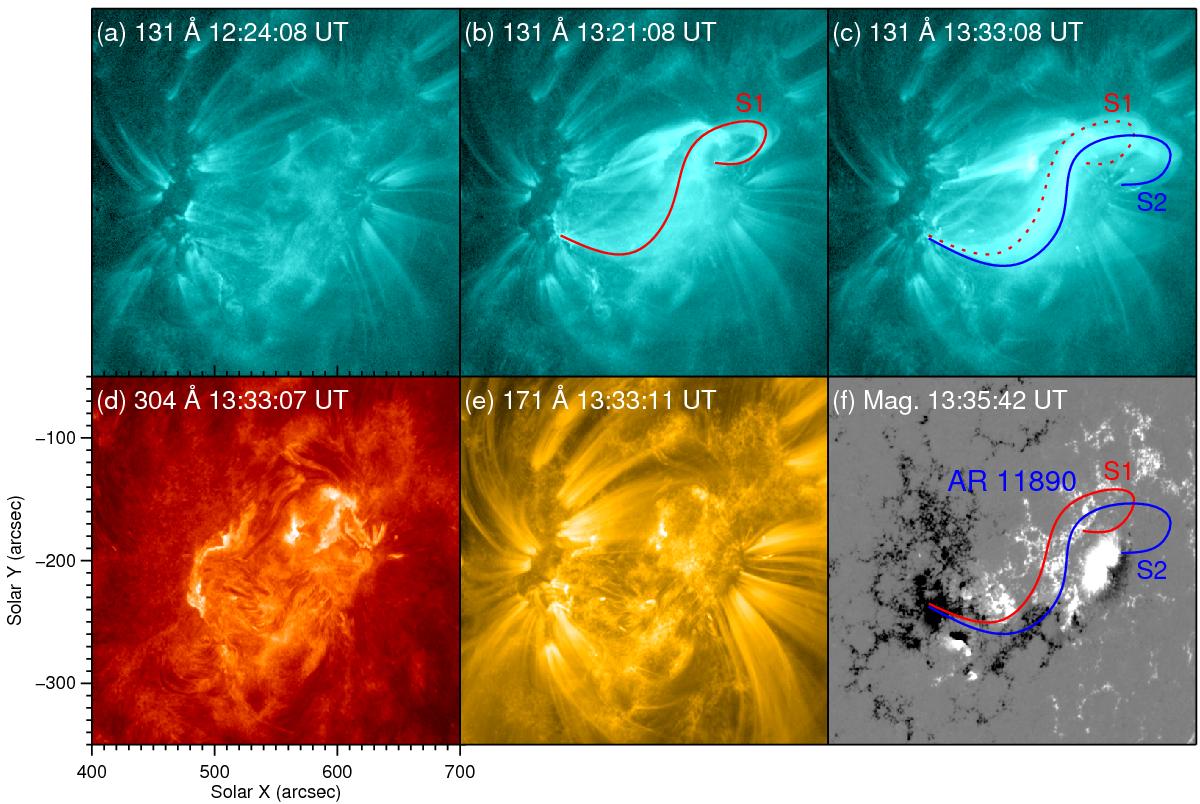
Panels a)−c): AIA 131 Å images showing a sigmoid flux rope proxy on 2013 November 11. The red curve S1 in panel b) denotes a sigmoid structure. The blue curve S2 in panel c) outlines another sigmoid structure, and the red dotted curve S1 duplicates curve S1 in panel b). Panels d)−f): corresponding AIA 304 Å and 171 Å images and HMI magnetogram. The red and blue curves in panel f) delineate the duplicates of curves S1 and S2 in panel c). An animation (movie6.mp4) of the 131 Å channel shown in this figure is available online.
Current usage metrics show cumulative count of Article Views (full-text article views including HTML views, PDF and ePub downloads, according to the available data) and Abstracts Views on Vision4Press platform.
Data correspond to usage on the plateform after 2015. The current usage metrics is available 48-96 hours after online publication and is updated daily on week days.
Initial download of the metrics may take a while.