Fig. 6
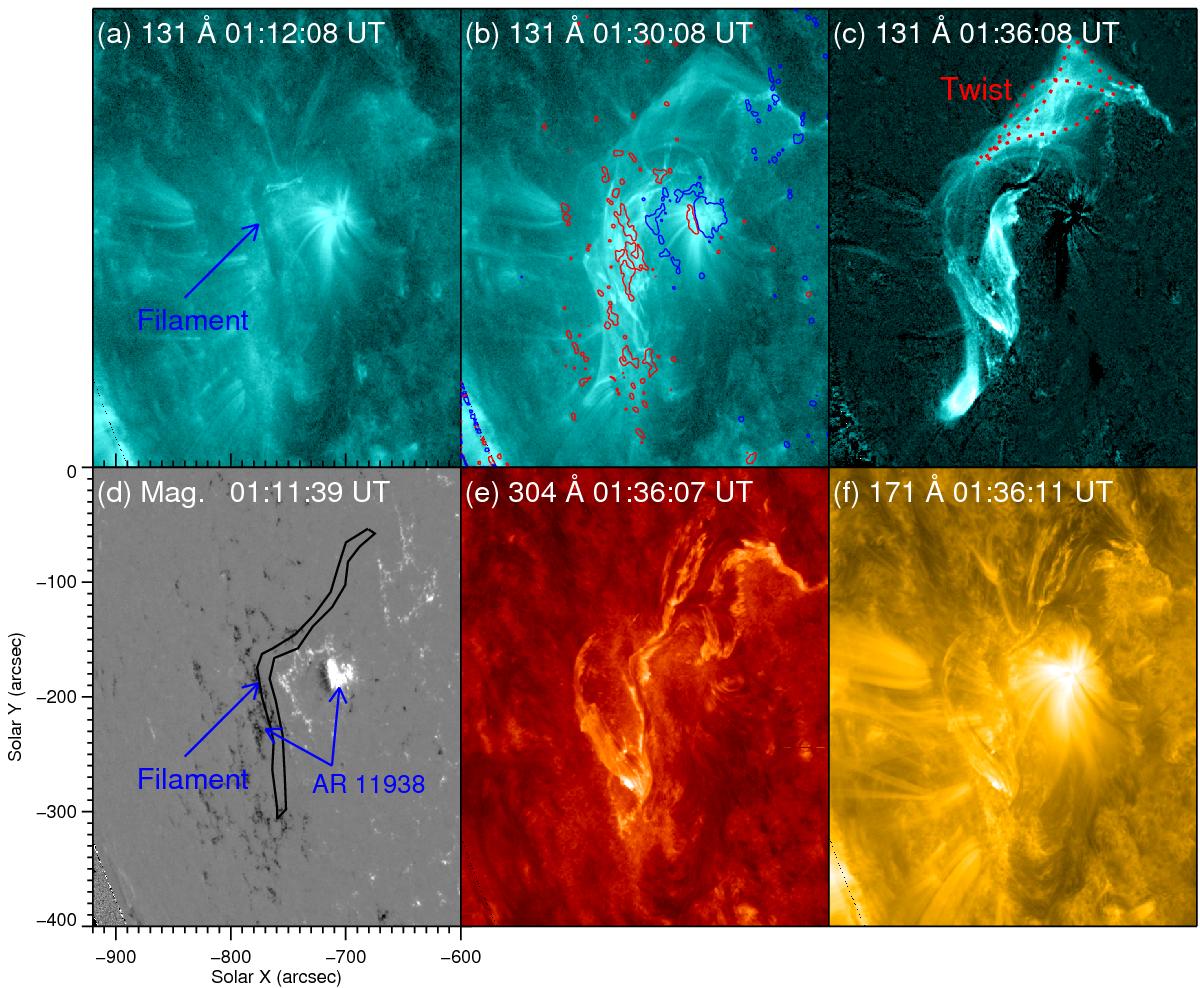
AIA 131 Å images (panels a) and b)) and the differential image between 01:12 UT and 01:36 UT (panel c)) showing a flux rope proxy rising from lower atmosphere on 2013 December 29. Panels d)−f): corresponding HMI magnetogram, AIA 304 Å, and 171 Å images. The blue and red solid curves in panel b) are the contours of the positive and negative underlying magnetic fields. The red dotted curves in panel c) outline the twisted threads of the flux rope proxy, and the black curve in panel d) outlines the general shape of the filament. An animation (movie5.mp4) of the 131 Å channel shown in this figure is available online.
Current usage metrics show cumulative count of Article Views (full-text article views including HTML views, PDF and ePub downloads, according to the available data) and Abstracts Views on Vision4Press platform.
Data correspond to usage on the plateform after 2015. The current usage metrics is available 48-96 hours after online publication and is updated daily on week days.
Initial download of the metrics may take a while.