Fig. 5
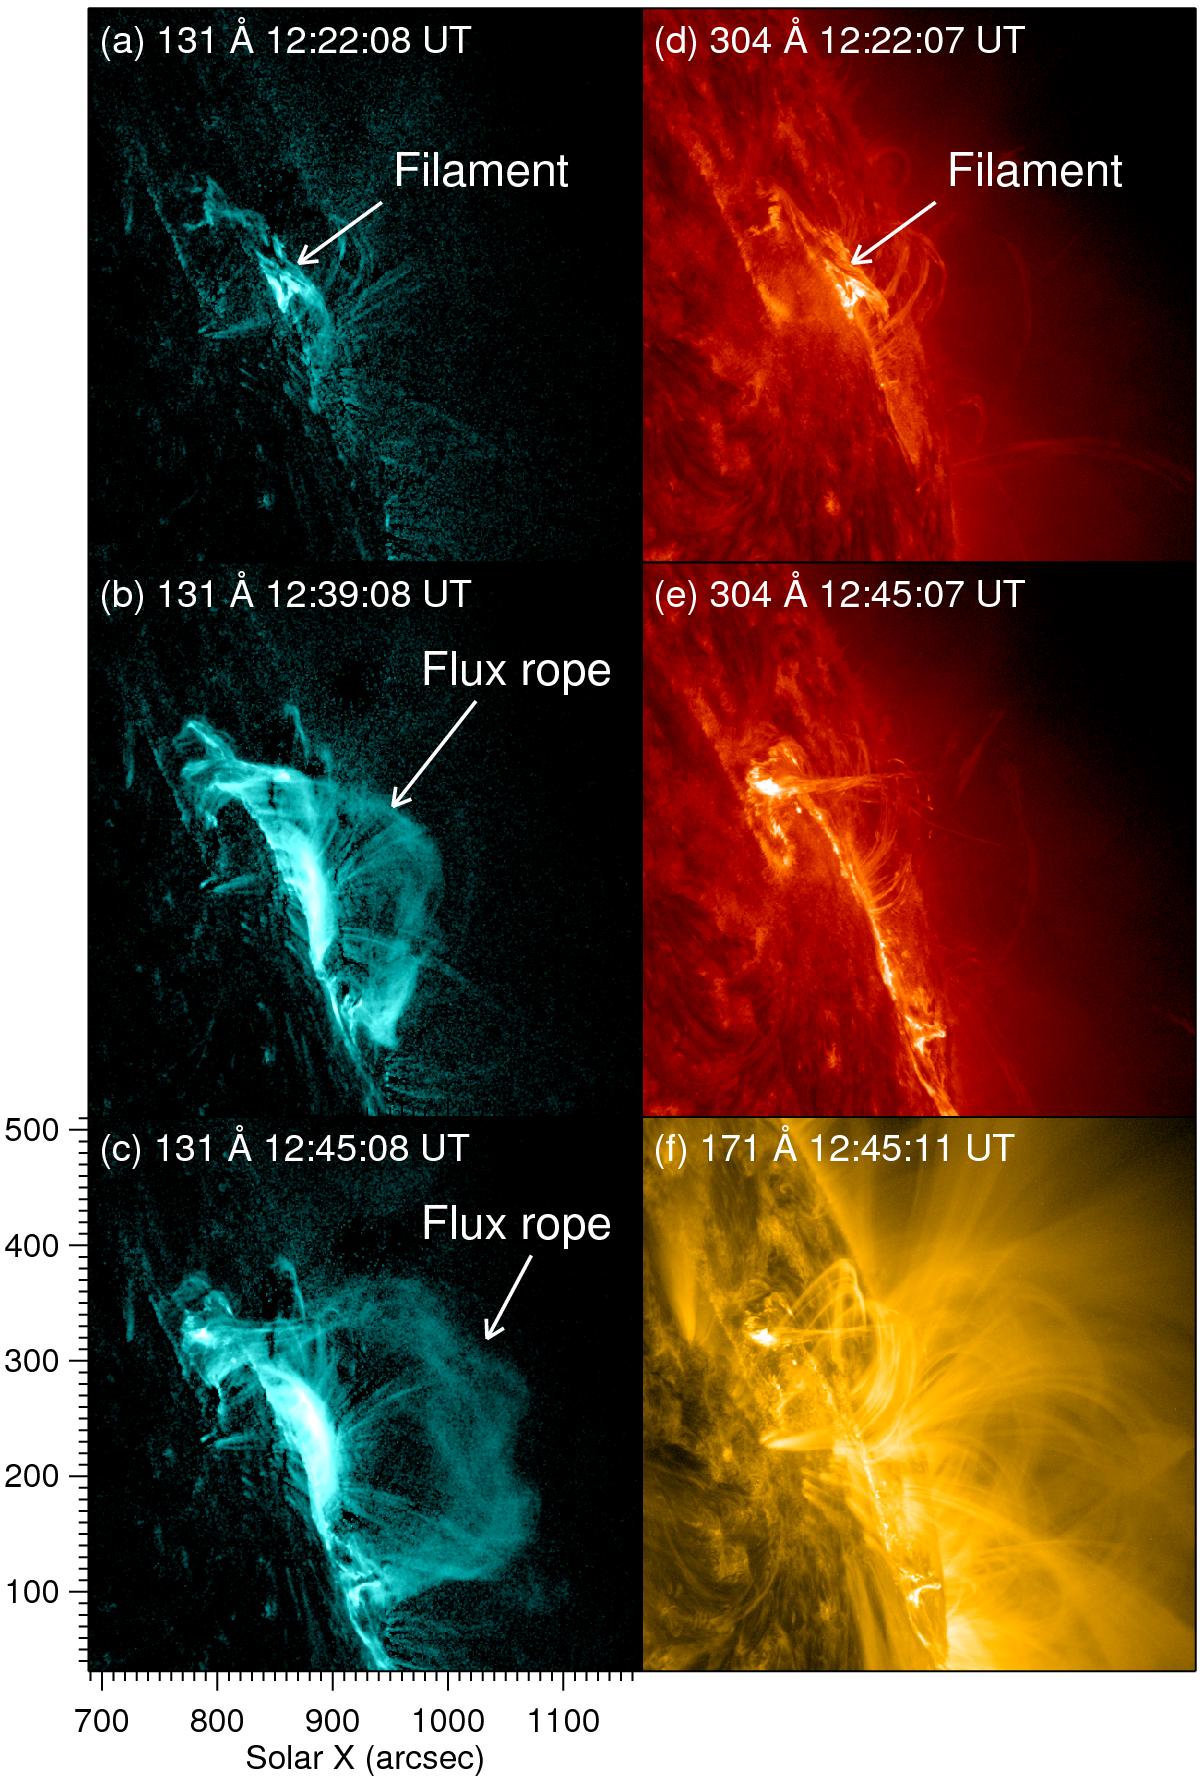
Panels a)−c): AIA 131 Å base-difference images (the base image is taken at 12:00 UT) showing a flux rope rising from lower atmosphere on 2013 May 22. Panel d): AIA 304 Å image showing the filament at the early rising phase of the flux rope. Panels e), f): corresponding AIA 304 Å and 171 Å images at 12:45 UT, respectively. An animation (movie4.mp4) of the 131 Å channel shown in this figure is available online.
Current usage metrics show cumulative count of Article Views (full-text article views including HTML views, PDF and ePub downloads, according to the available data) and Abstracts Views on Vision4Press platform.
Data correspond to usage on the plateform after 2015. The current usage metrics is available 48-96 hours after online publication and is updated daily on week days.
Initial download of the metrics may take a while.