Fig. 2
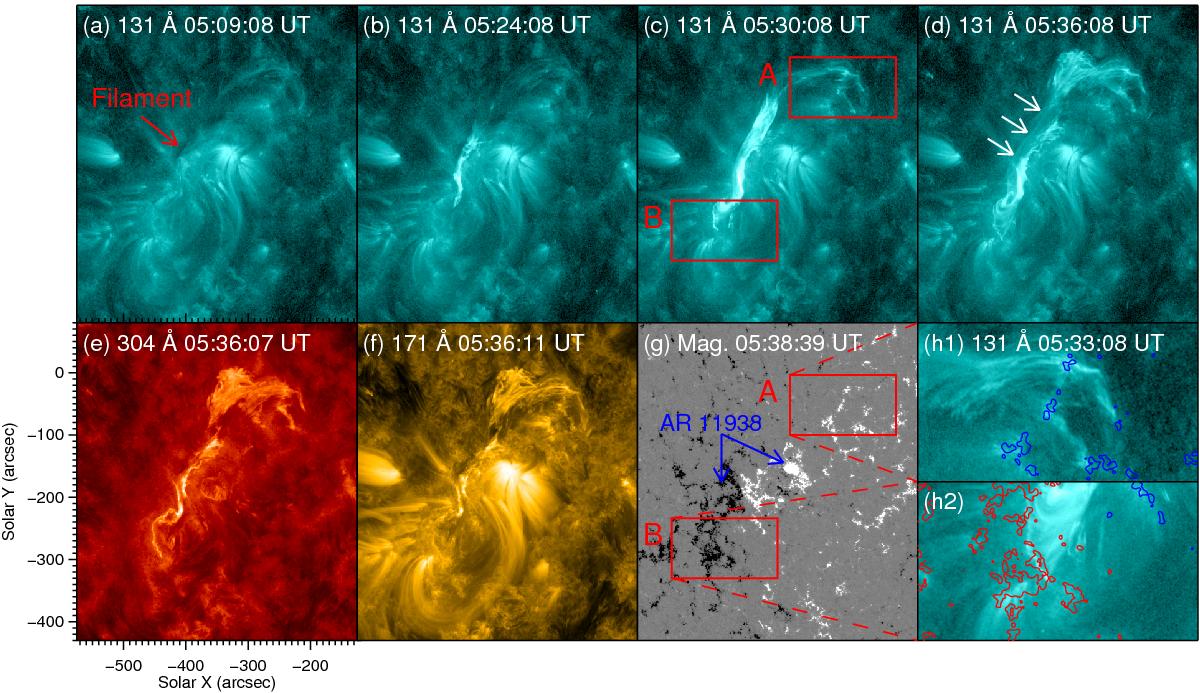
Panels a)–d): sequence of AIA 131 Å images showing a flux rope proxy tracked by active material of a filament on 2013 December 31. Panels e)–g): corresponding AIA 304 Å and 171 Å images and HMI magnetorgram when the flux rope was well observed. Panels h1), h2): two expanded 131 Å images outlined by rectangles A and B in panel c). The arrows in panel d) mark the parts of the structure that are only visible in the 131 Å band, and the blue and red curves in panels h1) and h2) are contours of the corresponding positive and negative magnetic fields. An animation (movie1.mp4) of the 304 Å and 131 Å channels shown in this figure is available online.
Current usage metrics show cumulative count of Article Views (full-text article views including HTML views, PDF and ePub downloads, according to the available data) and Abstracts Views on Vision4Press platform.
Data correspond to usage on the plateform after 2015. The current usage metrics is available 48-96 hours after online publication and is updated daily on week days.
Initial download of the metrics may take a while.