Fig. 1
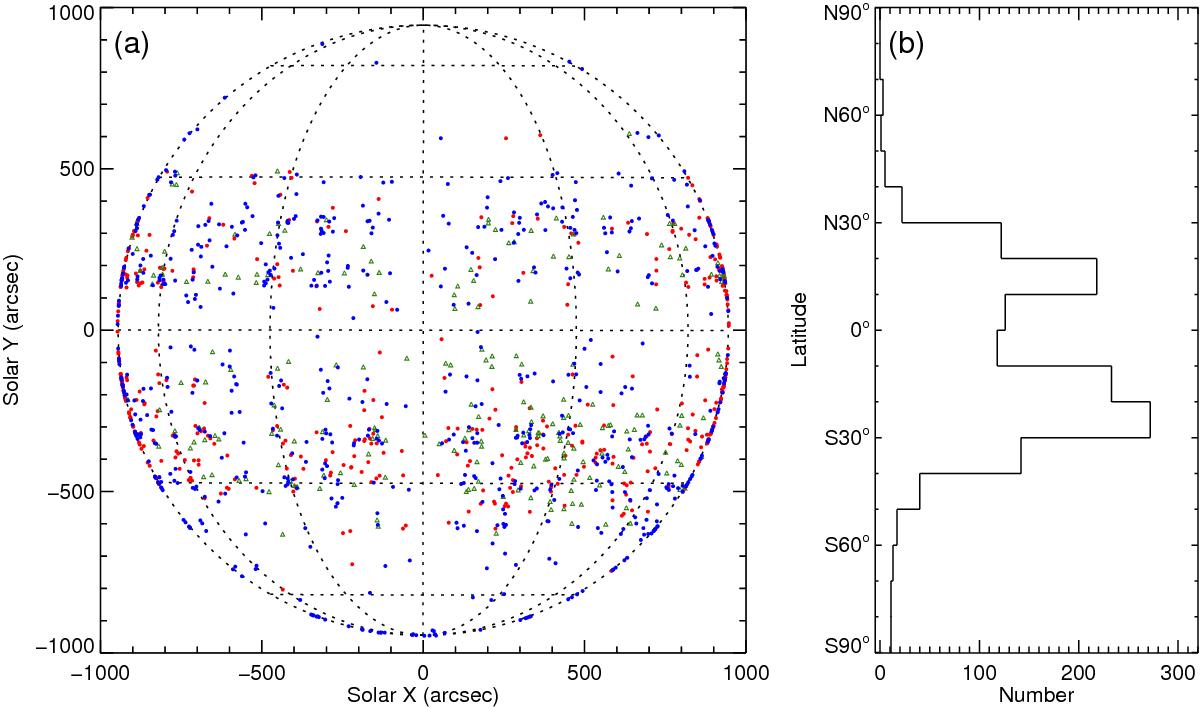
Solar disk distribution (left panel) and latitudinal distribution (right panel) of all the 1354 flux rope proxies. Each blue dot represents a flux rope proxy tracked by a filament eruption (activity). Each red dot represents a rope proxy that appears to be rising from the lower atmosphere or an EUV brightening in the corona, and each green triangle represents a proxy indicated by sigmoid structures.
Current usage metrics show cumulative count of Article Views (full-text article views including HTML views, PDF and ePub downloads, according to the available data) and Abstracts Views on Vision4Press platform.
Data correspond to usage on the plateform after 2015. The current usage metrics is available 48-96 hours after online publication and is updated daily on week days.
Initial download of the metrics may take a while.