Fig. 9
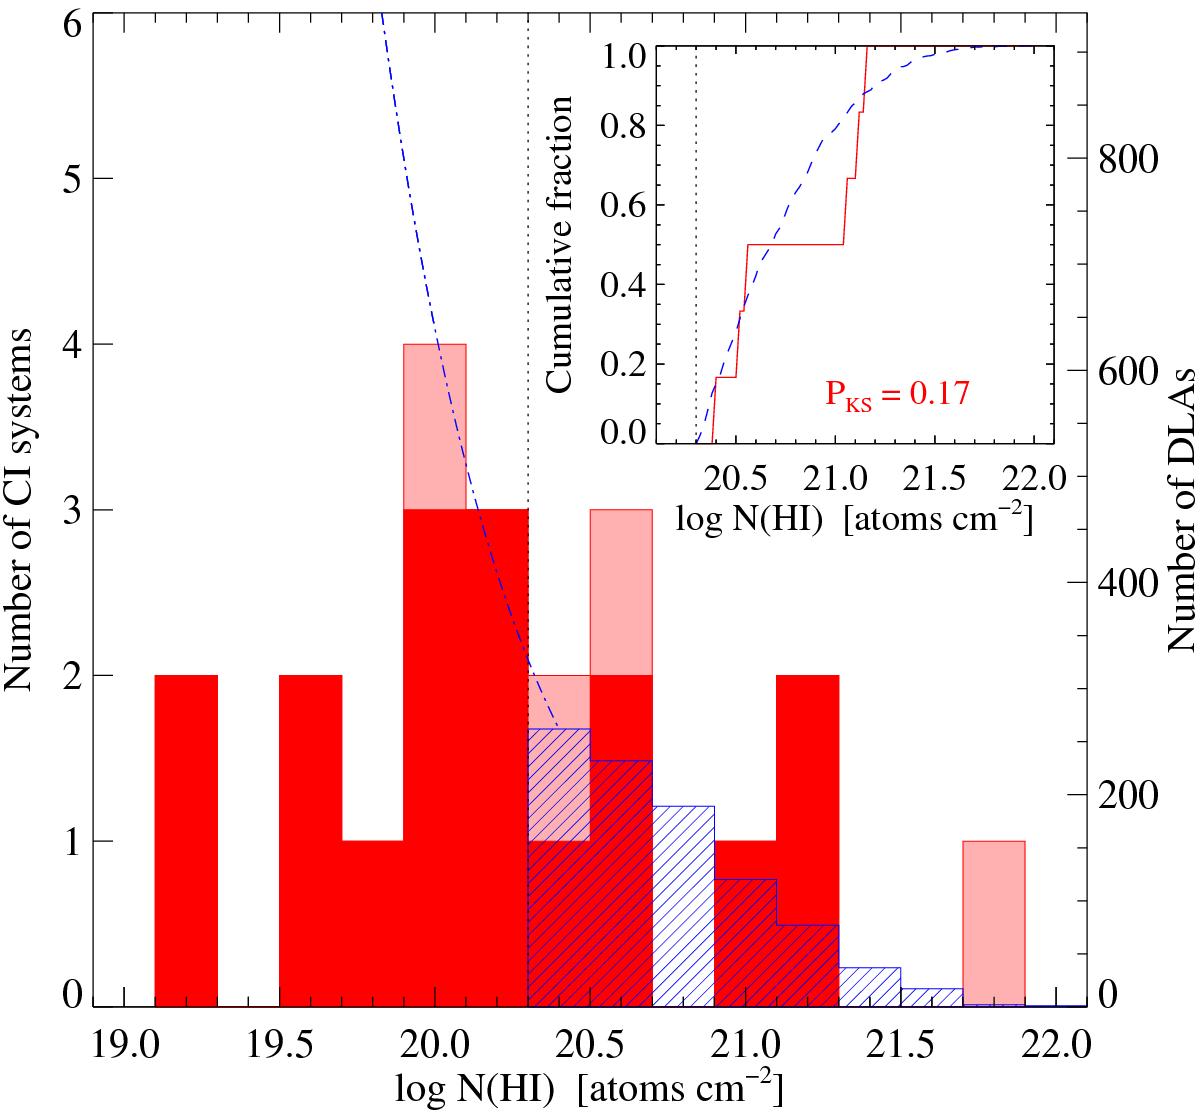
Neutral atomic-hydrogen column-density distribution of C i absorbers (red-filled histogram; left-hand axis). Proximate systems are displayed in salmon. The N(H i) distribution of intervening DLAs from SDSS DR7 (Noterdaeme et al. 2009b, blue-hashed histogram) is over-plotted using a different scaling (right-hand axis) so that the areas of the two histograms above log N(H i) = 20.3 are equal. The curve is a fit of the distribution in the sub-DLA regime from Prochaska et al. (2014). The inset shows the cumulative N(H i) distributions of the intervening C i and DLA samples starting at log N(H i) = 20.3 (atoms cm-2) and the two-sided Kolmogorov-Smirnov test probability that the two distributions come from the same parent population.
Current usage metrics show cumulative count of Article Views (full-text article views including HTML views, PDF and ePub downloads, according to the available data) and Abstracts Views on Vision4Press platform.
Data correspond to usage on the plateform after 2015. The current usage metrics is available 48-96 hours after online publication and is updated daily on week days.
Initial download of the metrics may take a while.