Fig. 8
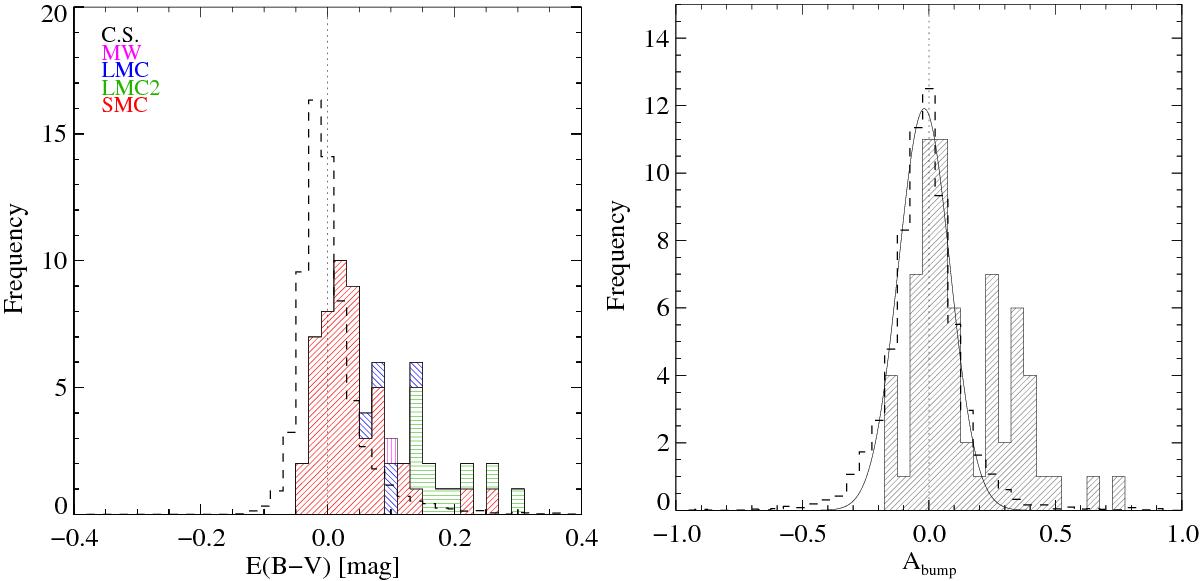
Left-hand panel: histogram of reddening for the sample of 66 QSOs whose spectra were found to exhibit C i absorption (multi-colour). The colour/hash coding for the different C i-detected lines of sight relates to the best-fitting extinction law (red: SMC; blue: LMC; green: LMC2; purple: MW). The distribution of reddening from the QSO control sample (C.S.), i.e., the sum of the normalized distributions of individual QSO control samples, is displayed with dashed lines. Right-hand panel: same as in the left-hand panel but for the histogram of 2175 Å bump strengths. The distribution from the QSO control sample is well represented by a Gaussian profile (solid curve).
Current usage metrics show cumulative count of Article Views (full-text article views including HTML views, PDF and ePub downloads, according to the available data) and Abstracts Views on Vision4Press platform.
Data correspond to usage on the plateform after 2015. The current usage metrics is available 48-96 hours after online publication and is updated daily on week days.
Initial download of the metrics may take a while.