Fig. 7
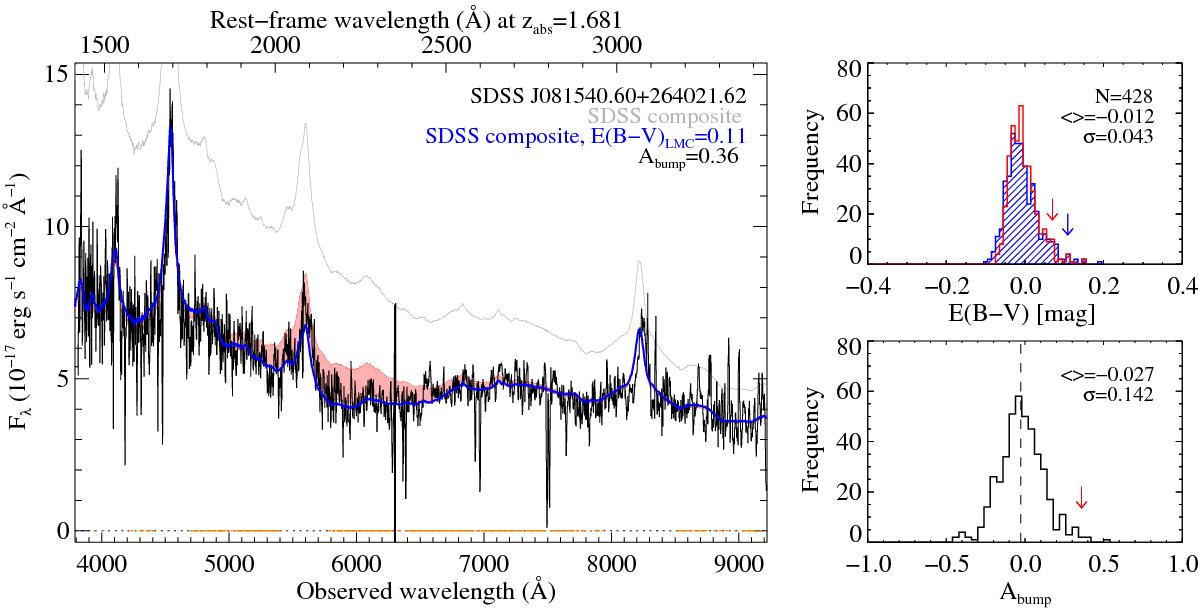
Left-hand panel: illustration of reddening measurement based on QSO SED fitting. The blue curve shows our best fit to the QSO continuum using the QSO template spectrum from Vanden Berk et al. (2001) and the best-fitting LMC extinction law at the redshift of the C i absorber. The non-extinguished QSO template is displayed in grey. The additional presence of a 2175 Å absorption feature is shown by the light-red shaded area (i.e., Abump). The broken orange line at zero ordinate indicates the wavelength regions devoid of QSO emission lines, strong absorption lines and sky residuals, that were used during the χ2 minimization. Upper right-hand panel: distribution of reddening measured in the QSO control sample assuming either a SMC (red) or the best-fitting extinction law (in this case, LMC; blue). The reddening values of the line of sight under consideration are indicated by downward arrows. Lower right-hand panel: same as above but for the distribution of 2175 Å bump strengths.
Current usage metrics show cumulative count of Article Views (full-text article views including HTML views, PDF and ePub downloads, according to the available data) and Abstracts Views on Vision4Press platform.
Data correspond to usage on the plateform after 2015. The current usage metrics is available 48-96 hours after online publication and is updated daily on week days.
Initial download of the metrics may take a while.