Fig. 6

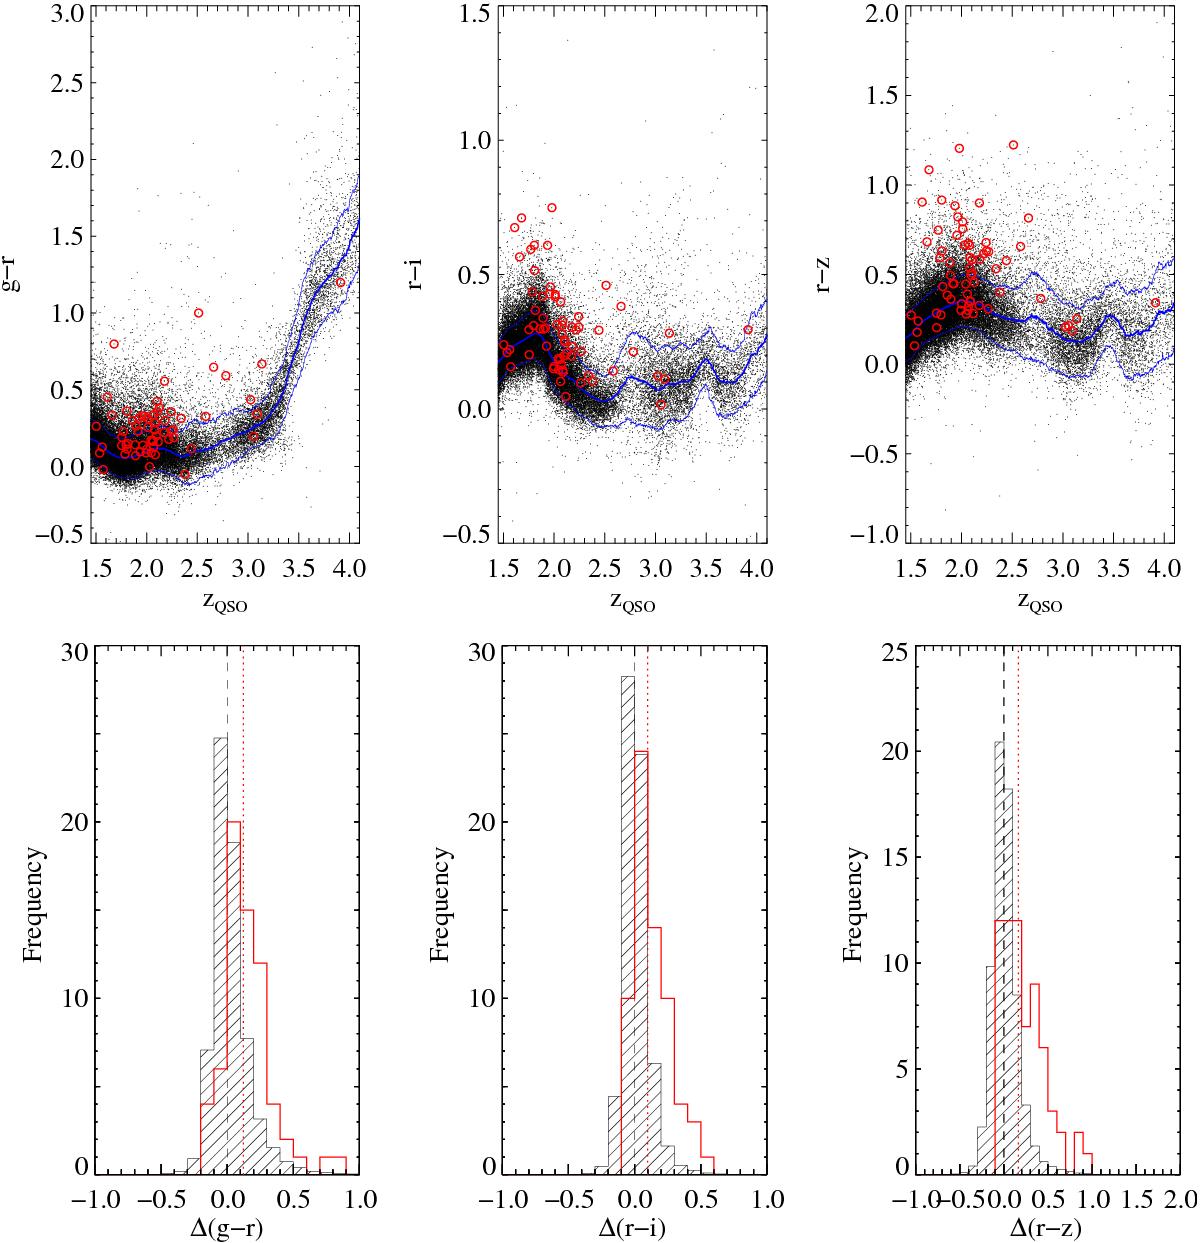
Upper panels: colours of the 41 696 SDSS QSOs whose spectra were searched for C i absorption versus QSO emission redshift. (g−r), (r−i) and (r−z) colours are displayed in the left-, middle-, and right-hand panels, respectively. The thick blue line shows the median QSO colour as a function of redshift. Thin blue lines show one standard deviation away from that median. The red circles indicate the 66 lines of sight passing through C i-detected gas. Lower panels: distribution of colour excesses (defined as, e.g.: (g−r)−⟨g−r⟩zQSO for Δ(g−r)) for the 66 QSOs whose spectra were found to exhibit C i absorption (thick red histogram) compared to the whole QSO sample (thin-hashed histogram, scaled down by a factor of 632 to have the same area). In each panel (from left to right: Δ(g−r), Δ(r−i) and Δ(r−z)), vertical dotted red lines indicate the median colour excesses of the sample of QSOs with detected C i absorption. The median values for the whole QSO sample are shown by vertical dashed lines.
Current usage metrics show cumulative count of Article Views (full-text article views including HTML views, PDF and ePub downloads, according to the available data) and Abstracts Views on Vision4Press platform.
Data correspond to usage on the plateform after 2015. The current usage metrics is available 48-96 hours after online publication and is updated daily on week days.
Initial download of the metrics may take a while.


