Fig. 4
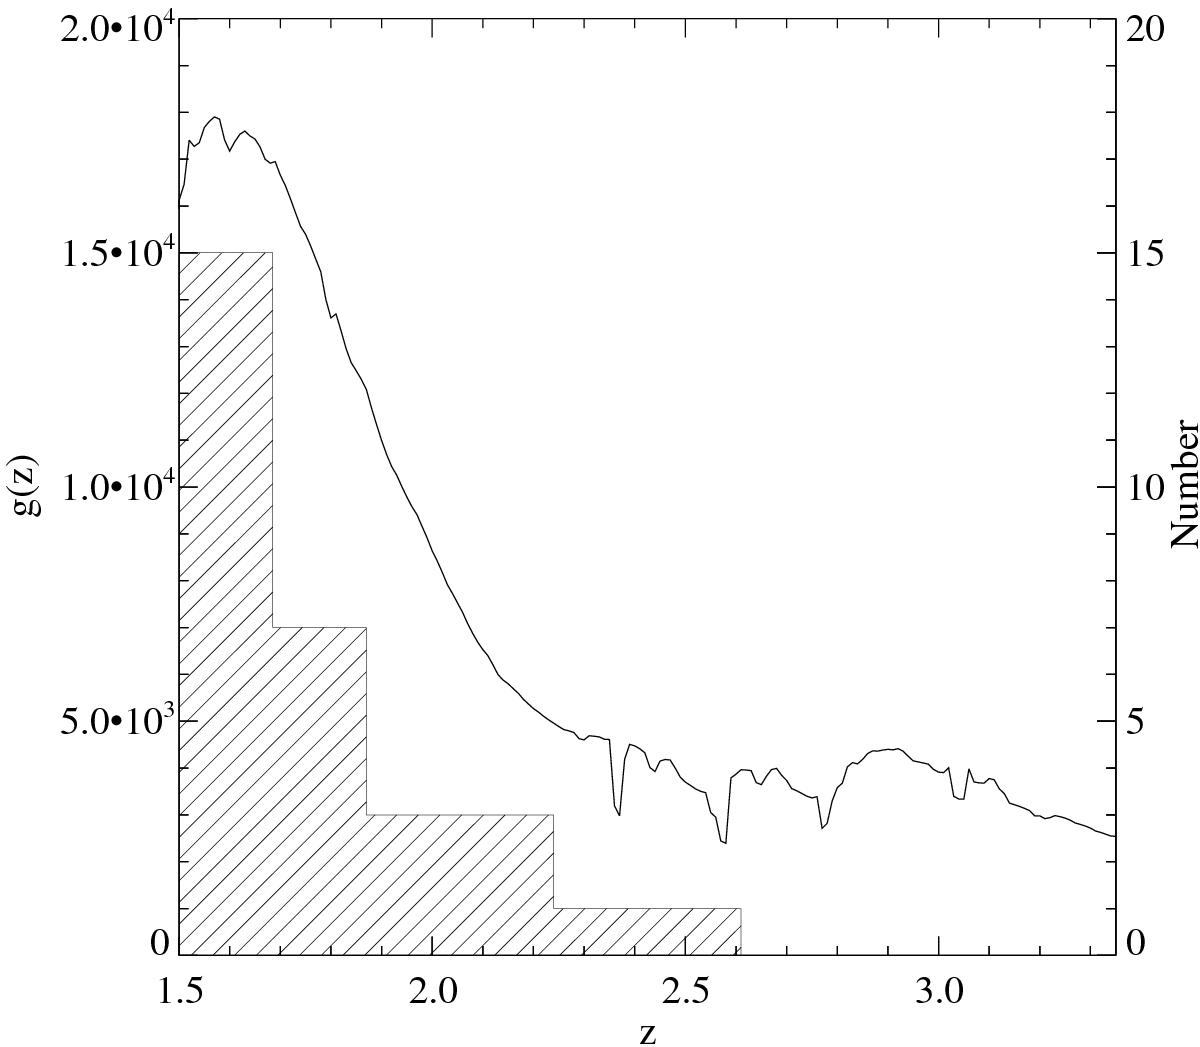
Statistical sensitivity function of our C i survey, g(z) (solid curve; left-hand axis). The dips seen at z ~ 2.35 (resp. 2.6) are caused by C i λ1656 (resp. C i λ1560) falling over bad pixels at the junction between the two SDSS CCD chips. Dips at higher redshifts (z ~ 2.8,3.05) are due to telluric lines (e.g., [O i] λ6300). The histogram (right-hand axis) shows the C i-absorber number counts in different redshift bins for intervening systems with rest-frame equivalent width above our completeness limit, i.e., Wr(λ1560) ≥ 0.4 Å.
Current usage metrics show cumulative count of Article Views (full-text article views including HTML views, PDF and ePub downloads, according to the available data) and Abstracts Views on Vision4Press platform.
Data correspond to usage on the plateform after 2015. The current usage metrics is available 48-96 hours after online publication and is updated daily on week days.
Initial download of the metrics may take a while.