Fig. 12
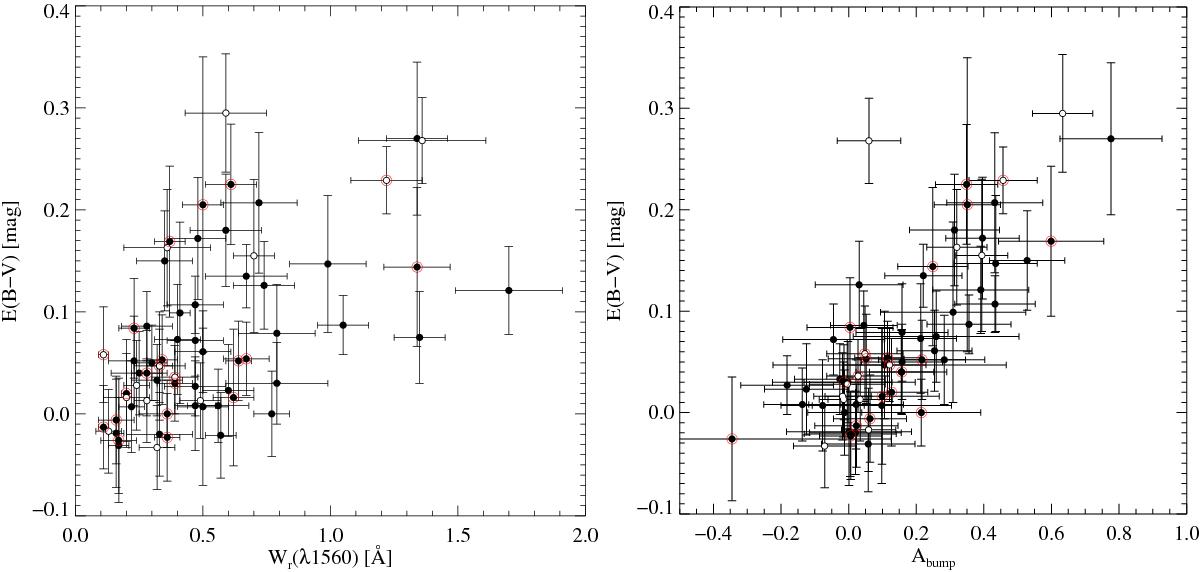
Left-hand panel: reddening of the background QSOs with detected C i absorption (overall sample) versus C i λ1560 rest-frame equivalent width. Symbol conventions are the same as in Fig. 10. The data points circled in red correspond to the H i subsample. Right-hand panel: same as in the left-hand panel with the exception that reddening is plotted against the 2175 Å bump strength.
Current usage metrics show cumulative count of Article Views (full-text article views including HTML views, PDF and ePub downloads, according to the available data) and Abstracts Views on Vision4Press platform.
Data correspond to usage on the plateform after 2015. The current usage metrics is available 48-96 hours after online publication and is updated daily on week days.
Initial download of the metrics may take a while.