Fig. 11
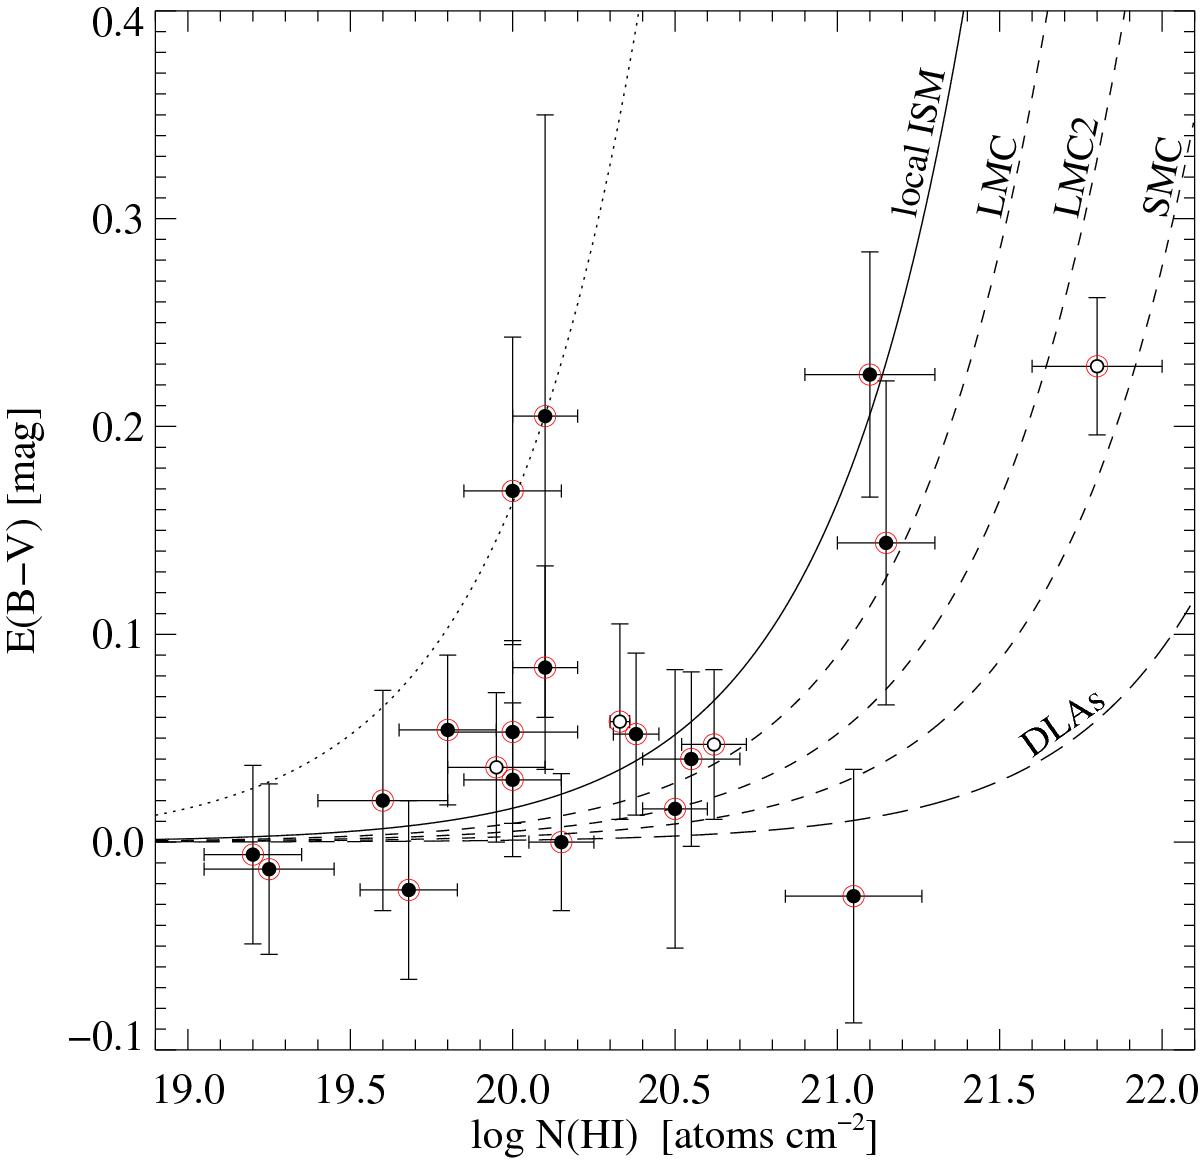
Reddening of the background QSOs with detected C i absorption versus N(H i) of the C i absorbers. Symbol conventions are the same as in Fig. 10. The solid curve shows the relation observed in the local ISM where E(B−V) /N(H)= 1.63 × 10⁻²² mag atoms-1 cm2 (Gudennavar et al. 2012). The dotted curve illustrates a reddening per hydrogen atom ten times higher than that. The dashed curves correspond to the observations of the Magellanic Clouds (Gordon et al. 2003). The long-dashed curve shows the relation derived for typical DLAs at zabs ≈ 2.8 (e.g., Vladilo et al. 2008; Khare et al. 2012).
Current usage metrics show cumulative count of Article Views (full-text article views including HTML views, PDF and ePub downloads, according to the available data) and Abstracts Views on Vision4Press platform.
Data correspond to usage on the plateform after 2015. The current usage metrics is available 48-96 hours after online publication and is updated daily on week days.
Initial download of the metrics may take a while.