Fig. 1
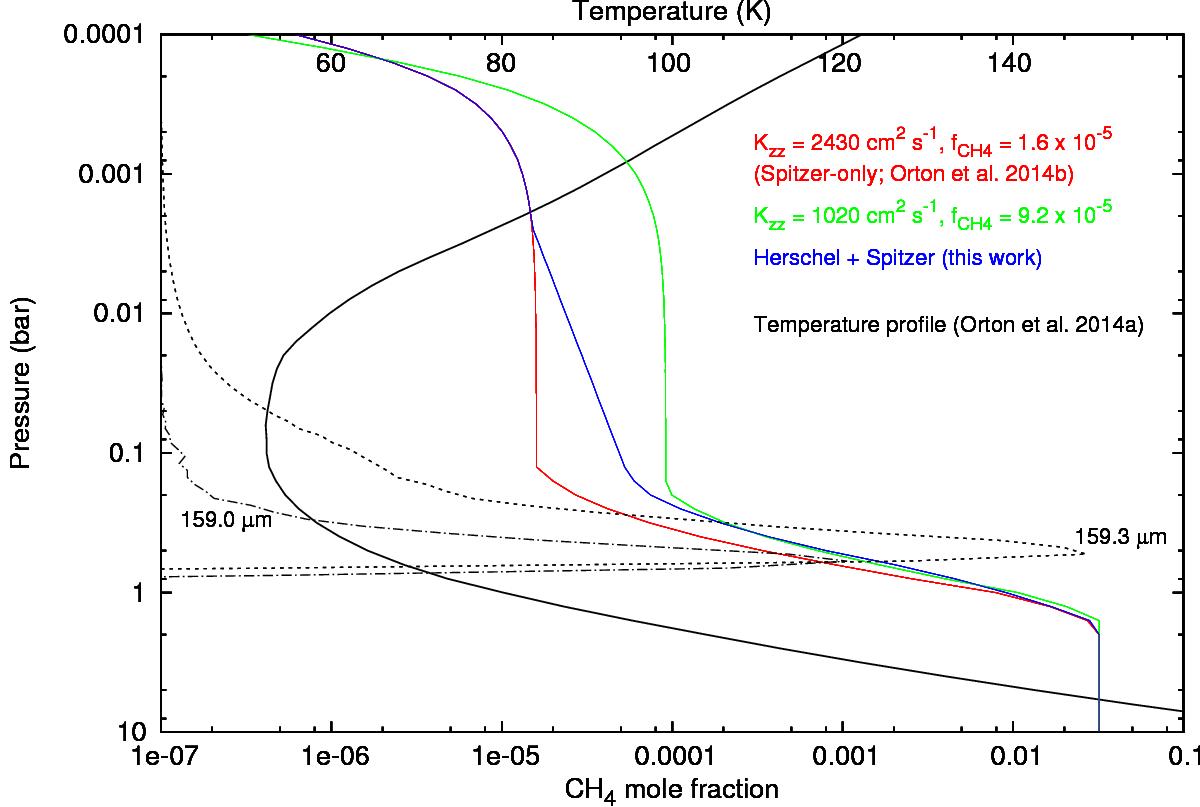
Temperature (solid black line) and CH4 profiles in Uranus. Red and green profiles are based on diffusion models. The blue curve is the empirical profile that simultaneously matches Herschel/PACS and Spitzer/IRS (see text). The thin dotted (dashed-dotted) line shows weighting functions in the core – 159.3 μm (wing – 159.0 μm) of the CH4 line at PACS resolution, calculated for this solution profile. The Spitzer/IRS spectrum (Fig. 3) also constrains the CH4 profile in the region of ~0.1 mbar.
Current usage metrics show cumulative count of Article Views (full-text article views including HTML views, PDF and ePub downloads, according to the available data) and Abstracts Views on Vision4Press platform.
Data correspond to usage on the plateform after 2015. The current usage metrics is available 48-96 hours after online publication and is updated daily on week days.
Initial download of the metrics may take a while.