| Issue |
A&A
Volume 579, July 2015
|
|
|---|---|---|
| Article Number | L1 | |
| Number of page(s) | 4 | |
| Section | Letters | |
| DOI | https://doi.org/10.1051/0004-6361/201526488 | |
| Published online | 19 June 2015 | |
Mercapto radical (SH) in translucent interstellar clouds⋆
1 Sackler Laboratory for Astrophysics, Leiden Observatory, University of Leiden, PO Box 9513, 2300 RA Leiden, The Netherlands
e-mail: This email address is being protected from spambots. You need JavaScript enabled to view it.
2 Instituto de Astronomia, Universidad Catolica del Norte, Av. Angamos 0610, Antofagasta, Chile
3 Pulkovo Observatory, Pulkovskoe Shosse 65, 196140 Saint-Petersburg, Russia
4 Center for Astronomy, Nicholas Copernicus University, Gagarina 11, 87-100 Toruń, Poland
Received: 7 May 2015
Accepted: 24 May 2015
Abstract
We present the first detection of rotationally resolved electronic transitions of the mercapto radical (SH) in the near-ultraviolet in translucent interstellar clouds. Observational data acquired by the Ultraviolet and Visual Echelle Spectrograph of the Very Large Telescope were used to search for the near-ultraviolet absorption spectra of SH. Two weak absorption features at ~3242.40 and 3240.66 Å, assigned as the pP11(3/2) and the (qP21(3/2) + qQ11(3/2)) doublet transitions in the A2Σ+–X2Π (0, 0) band of SH, respectively, were identified in the averaged spectrum of four selected lines of sight: HD 73882, HD 78344, HD 80077, and HD 154368. These features are weak, but can be identified within a 3σ detection limit, and are found in other published data sets as well. We compiled a set of line positions and oscillator strengths of SH to facilitate the data analysis. We derived an averaged value of the SH column density, ~1.5 ± 0.3 × 1013 cm-2, that is most likely representative for the magnitude of SH column densities in individual SH-rich translucent clouds. This value is also consistent with predictions from models for C-type shocks and turbulent dissipation regions with typical translucent cloud conditions.
Key words: ISM: clouds / ISM: molecules / ISM: lines and bands / ultraviolet: ISM
Based on observations collected at the European Organisation for Astronomical Research in the Southern Hemisphere, Chile, under programs 092.C-0019(A) and 082.C-0566(A).
© ESO, 2015
1. Introduction
In recent years, the gas-phase sulfur chemistry in the diffuse interstellar medium (ISM) has attracted much interest from astronomers and astrophysicists since sulfanylium (SH+) was identified as a widespread interstellar molecule (Menten et al. 2011). In the diffuse ISM, the reactions of atomic sulfur (S, S+) and the sulfur hydrides (SH, SH+, and SH ) with H2 are all endothermic (Millar et al. 1986). Therefore, their reaction products will be formed at detectable abundance if the corresponding reaction endothermicity is overcome by turbulent dissipation, shocks, or shears. Submillimeter absorptions from both the neutral SH, that is, the mercapto radical, and the sulfanylium (SH+) have been observed in foreground diffuse molecular clouds toward star-forming regions (Menten et al. 2011; Godard et al. 2012; Neufeld et al. 2012, 2015). Consequently, the analysis of sulfur hydrides provides unique physical and chemical constraints on models that are applied to the interstellar medium. In particular, SH+ has been suggested as an important probe of turbulence in the diffuse ISM (Godard et al. 2012, 2014).
Translucent interstellar clouds allow studying the chemistry over the complete range of optical extinctions (1.0 <Av< 5.0 mag edge-to-center) that bridge the transition from classic diffuse interstellar clouds to dense molecular clouds. However, observational identifications of sulfur-bearing molecules in translucent clouds remain rather limited. Following the predictions from the magnetohydrodynamic (MHD) shock models (Pineau des Forêts et al. 1986; Millar et al. 1986), the near-ultraviolet absorption features of the electronic transitions of SH+ in diffuse or translucent interstellar clouds have been searched for in several observational studies, but all attempts were unsuccessful (Millar & Hobbs 1988; Magnani & Salzer 1989, 1991; Bhatt & Cami 2015). In contrast, to our knowledge, similar searches for SH in translucent clouds have not been reported. In this letter, we present the first detection of SH absorption features in the near-UV in translucent interstellar clouds. The results presented here are well consistent with the predictions of SH production from the models for turbulent dissipation regions (TDRs) and C-type shocks that were recently introduced by Godard et al. (2009, 2014), Lesaffre et al. (2013), Neufeld et al. (2015).
List of the observed targets.
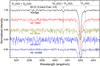 |
Fig. 1 Spectra of the SH A |
2. Observations
Observations of the four selected targets in Table 1 were made using the Ultraviolet and Visual Echelle Spectrograph (UVES) at the 8 m UT2 telescope (Paranal Observatory, ESO, Chile). Spectra of HD 73882, HD 78344, and HD 80077 were acquired from our observational run in March 2014 [program 092.C-0019(A)], and HD 154368 in March 2009 [program 082.C-0566(A)]. The standard mode DIC1(346+580) of UVES, with slit widths of 0.̋4 and 0.̋3 for the blue and red branches, respectively, was applied to satisfy the two-pixel criteria for the slit image projection to the corresponding CCD cameras. This provides the highest possible resolving power of ~80 000 for the recorded spectra in the near-UV region (3040–3875 Å).
All spectra were processed in a standard way using both IRAF packages and our own DECH1 codes. The wavelength scale of each spectrum was shifted to the interstellar rest wavelength frame of the Na I 3302 Å doublet. Only in the spectrum of HD 154368, this doublet shows two clearly resolved components. For this line of sight, the deepest (dominating) component, that is, the red one, is used as a reference.
Line positions and oscillator strengths of the SH A –X2Π (0, 0) band.
3. Molecular data
The A2Σ+–X2Π electronic transition system of SH has been studied in the laboratory (see, e.g., Ubachs et al. 1983). However, the electronic transition wavenumbers (and/or wavelengths) required for astronomical use were only reported in Ramsay (1952). In Table 2, we summarize the wavelengths of the rotationally resolved electronic transitions from the lowest ground-state (N = 0, J = 3/2) level in the (0, 0) bands as reported by Ramsay (1952). From refitting their experimental data, the absolute wavelength accuracy is estimated to be ~0.01 Å, with a maximum uncertainty smaller than ~0.02 Å.
The line oscillator strengths were calculated with the Pgopher software2, following a similar procedure as recently introduced for OH+ (Zhao et al. 2015). Here we employed an effective 2Σ+–X2Π Hamiltonian that was adapted using the molecular constants reported by Ramsay (1952) and an effective transition dipole moment (0.266 Debye) for the (0, 0) band that was determined from the calculated band oscillator strength f00 = 1.02 × 10⁻³ by Senekowitsch et al. (1985). The resulting line oscillator strengths are listed in Table 2.
4. Results and discussion
Figure 1 shows the observational spectra in the 3237–3243 Å wavelength region, covering most of the predicted SH absorption lines listed in Table 2. A calculated spectrum of the SH (0, 0) band with a rotational temperature of 4 K is shown at the top of Fig. 1 to guide our search for SH absorption features. Similar as discussed for OH+ (Zhao et al. 2015), this calculated 4 K spectrum is representative for rotational temperatures ranging from 1 to 8 K and can be used for a direct search for SH absorption features in the observational spectra: the rotational excitation temperature of this polar molecule should not exceed 5 K in translucent interstellar clouds.
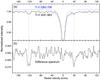 |
Fig. 2 a) Ti II 3242 and 3384 Å lines in our averaged spectrum; b) the difference spectrum of the two Ti II lines in a). For a direct comparison, the two Ti II lines in panel a) are shifted to the radial velocity frame, and the central absorption depth of the 3384 Å line is normalized to that of the 3242 Å line. The two absorption features of SH we identified are marked by vertical dashed lines. |
As is visible in Fig. 1, two weak absorption features at ~3242.40 and 3240.66 Å, nearly the same as the wavelengths listed in Table 2 for SH  and (
and ( +
+  ) doublet transitions, respectively, are recognizable, but only with low signal-to-noise ratios (S/N) in the individual spectra. Consequently, an unambiguous identification of the two features in these spectra is challenging. To further visualize the two weak features, the four selected spectra were averaged, and the resulting spectrum is also shown in Fig. 1. In this superposition spectrum, the 3240.66 and 3242.40 Å features have become clearly visible, even though the absorption strengths remain weak. Compared to the calculated spectrum, very small red shifts (about +0.015 Å, or + 1.4 km s-1) for central wavelengths of the two features are found, which may originate from the limited accuracy of the laboratory data in Ramsay (1952) or from a small radial velocity difference between SH and Na I in translucent interstellar clouds. We also searched for the other three weaker transitions of SH (listed in the lower part of Table 2). These three transitions are below the detection limit, even in the averaged spectrum.
Special care is needed because the observed positions are very close to the strong Ti II 3242 Å interstellar absorption feature that has been found to exhibit a complex component structure along many lines of sight (see Table A.2 in Bhatt & Cami 2015). To further strengthen the identification of the two features as originating from SH, that is, to exclude that these are not associated with the weak Doppler components of the Ti II 3242 Å feature, we carefully compared the multicomponent spectral profiles of the Ti II 3242 and 3384 Å lines. The upper panel (a) of Fig. 2 shows the comparison of the two Ti II lines based on our averaged spectrum. We found that the weak 3240.66 and 3242.40 Å features are completely invisible at the same rest velocities as the Ti II 3384 Å line, which supports our conclusion that the features arise from another carrier, that is, from SH. The difference spectrum (lower panel of Fig. 2) between the Ti II 3242 and 3384 Å lines, in which the red wing of the strong Ti II 3242 Å line is fully removed, allows measuring the equivalent widths of the 3242.40 Å and 3240.66 Å features, resulting in values of 0.83 ± 0.15 and 1.28 ± 0.20 mÅ, respectively. These two values are higher than the 3σ detection limit (~0.60 mÅ). The equivalent-width ratio of the two features is ~0.65 ± 0.16, which agrees well with the oscillator strength ratio (~0.57) of the SH 3242.40 Å and the ( + ) 3240.66 Å doublet lines and additionally supports our identification of the two weak features as originating from SH.
From our data set we derived an averaged SH column density in the four lines of sight of 1.5 ± 0.3 × 1013 cm-2. We compared this value to the recent modeling study of SH production in TDRs and C-type shocks (Lesaffre et al. 2013; Godard et al. 2014; Neufeld et al. 2015). Following the model predictions presented by Neufeld et al. (2015), the SH column density N(SH) in translucent interstellar clouds with typical cloud conditions of 1.0 <Av< 5.0 mag and a total hydrogen volume density nH ~ 100 cm-3 (see Zhao et al. 2015 for the case of OH+) was extrapolated in the range of 0.6–2.4 × 1013 cm-2 from the standard TDR model3, and 0.8–1.8 × 1013 cm-2 from the standard C-type shock model4. We conclude that the SH column density derived from our averaged spectrum agrees well with the model predictions, indicating that as in the foreground diffuse molecular clouds, the observation of SH in translucent clouds can be well explained with “warm chemistry” models for TDRs and/or C-type shocks.
Following the work presented above, we found that the two SH features we identified here are also visible in the reddened “superspectrum” recently presented by Bhatt & Cami (2015). This spectrum has a typical S/N ~ 1500 in the near-UV that is realized by averaging 185 VLT/UVES observations of 51 reddened, early-type (O and B) stars. In the bottom panel of their Fig. A.2.4, two weak narrow features at 3240.67 ± 0.03 and 3242.40 ± 0.03 Å can be clearly seen. Moreover, using their unreddened superspectrum in the same figure as a reference, we estimate the central absorption depths of the two features to be ~0.004–0.005, which is significantly higher than their 3σ detection limit. These values are approximately half of that (0.009 ± 0.003) derived from the averaged spectrum presented here, consistent with the possibility that the large data set of in total 51 diffuse/translucent clouds in Bhatt & Cami (2015) contains some SH-poor objects. This shows that the two features are real and fully coincide with the SH absorption lines we have found in our averaged spectra.
We also searched for the near-UV absorption features of A3Π–X3Σ− (0, 0) band of the SH+ cation in the 3330–3370 Å range in our averaged spectrum, using the line positions and oscillator strengths as given by Pineau des Forêts et al. (1986):  3363.49 Å (f = 6.2 × 10⁻⁴), and
  3339.97 Å (f = 4.6 × 10⁻⁴), and 3336.64 Å (f = 3.7 × 10⁻⁴). As in previous studies (Millar & Hobbs 1988; Magnani & Salzer 1989, 1991; Bhatt & Cami 2015), no evident narrow absorption features at the predicted wavelengths were found. An upper limit (3σ level) of the central absorption depth for the strongest SH+ absorption line at 3363.49 Å, ~0.004, was estimated from our averaged spectrum. With the assumption that the near-UV absorption lines of SH and SH+ in the same translucent cloud have similar FWHMs, we infer an upper limit for the SH+ column density of ~6.0 × 1012 cm-2, which agrees well with the previously estimated upper detection limits in diffuse or translucent interstellar clouds by Millar & Hobbs (1988) and Magnani & Salzer (1989, 1991).
5. Concluding remarks
We have presented the first identification of two absorption features (~3240.66 and 3242.40 Å) of rotationally resolved electronic transitions of the SH A2Σ+–X2Π (0, 0) band in translucent interstellar clouds. The two near-UV absorption features are weak, but can be unambiguously identified in the averaged spectrum of four selected lines of sight: HD 73882, HD 78344, HD 80077, and HD 154368. We derived a value for the SH column density, ~1.5 ± 0.3 × 1013 cm-2, from the averaged spectrum that is most likely representative for the magnitude of SH column densities in individual SH-rich translucent clouds. This result also agrees well with the model predictions of SH production in TDRs and C-type shocks.
Limited by the relatively low S/N in the near-UV spectra of reddened stars, it is challenging to accurately determine column densities and radial velocities of SH in individual lines of sight and to discuss the possible correlations between SH and other molecules (e.g., CH) in translucent interstellar clouds. For this, future studies are needed. These should be based on high-quality spectra of individual targets that are realized by co-adding or averaging many exposures acquired with large telescopes. The four lines of sight discussed here provide promising sample sources
for such further observational studies. More precise transition wavelengths (better than 0.005 Å) for the SH A2Σ+–X2Π laboratory spectra are required to further extend the interpretation of the observational data.
Pgopher, a Program for Simulating Rotational Structure, C. M. Western, University of Bristol, http://pgopher.chm.bris.ac.uk
For a turbulent rate-of-strain 3 × 10-11 s-1 and an invoked ion-neutral velocity drift of ~6–8 km s-1 as introduced in Neufeld et al. (2015). We adopt a total hydrogen column density NH ~ 5.8 × 1021 cm-2 (Bohlin et al. 1978; Rachford et al. 2002) that is typically for a sight line with target reddening of E(B−V) ~ 1.0, i.e., the averaged value of E(B−V) for the four targets we discuss here.
For a single C-type shock with a velocity of 14 km s-1 and a pre-shock magnetic field B0 = (nH)1/2μG as introduced in Neufeld et al. (2015).
Acknowledgments
D.Z. and H.L. acknowledge the support from NWO (VICI grant, and Dutch Astrochemistry Network) and NOVA. J.K. acknowledges the financial support of the Polish National Center for Science (grant UMO-2011/01/BST2/05399). G.A.G. acknowledges the support of Chilean fund FONDECYT-regular (project 1120190). The data analyzed here are based on observations made with ESO Telescopes at the Paranal Observatory under programs 092.C-0019(A) and 082.C-0566(A). We are grateful for the assistance of the Paranal Observatory staff members. We thank MSc. Bhatt and Prof. Cami (London, Canada), and Prof. Neufeld (Baltimore, US) for helpful discussions.
References
- Bhatt, N. H., & Cami, J. 2015, ApJS, 216, 22 [NASA ADS] [CrossRef] [Google Scholar]
- Bohlin, R. C., Savage, B. D., & Drake, J. F. 1978, ApJ, 224, 132 [NASA ADS] [CrossRef] [Google Scholar]
- Buscombe, W. 1969, MNRAS, 144, 31 [NASA ADS] [Google Scholar]
- Godard, B., Falgarone, E., & Pineau des Forêts, G. 2009, A&A, 495, 847 [NASA ADS] [CrossRef] [EDP Sciences] [Google Scholar]
- Godard, B., Falgarone, E., Gerin, M., et al. 2012, A&A, 540, A87 [NASA ADS] [CrossRef] [EDP Sciences] [Google Scholar]
- Godard, B., Falgarone, E., & Pineau des Forêts, G. 2014, A&A, 570, A27 [NASA ADS] [CrossRef] [EDP Sciences] [Google Scholar]
- Lesaffre, P., Pineau des Forêts, G., Godard, B., et al. 2013, A&A, 550, A106 [NASA ADS] [CrossRef] [EDP Sciences] [Google Scholar]
- Magnani, L., & Salzer, J. J. 1989, AJ, 98, 926 [NASA ADS] [CrossRef] [Google Scholar]
- Magnani, L., & Salzer, J. J. 1991, AJ, 101, 1429 [NASA ADS] [CrossRef] [Google Scholar]
- Menten, K. M., Wyrowski, F., Belloche, A., et al. 2011, A&A, 525, A77 [NASA ADS] [CrossRef] [EDP Sciences] [Google Scholar]
- Millar, T. J., & Hobbs, L. M. 1988, MNRAS, 231, 953 [NASA ADS] [CrossRef] [Google Scholar]
- Millar, T. J., Adams, N. G., Smith, D., Lindinger, W., & Villinger, H. 1986, MNRAS, 221, 673 [Google Scholar]
- Neufeld, D. A., Falgarone, E., Gerin, M., et al. 2012, A&A, 542, L6 [NASA ADS] [CrossRef] [EDP Sciences] [Google Scholar]
- Neufeld, D. A., Godard, B., Gerin, M., et al. 2015, A&A, 577, A49 [NASA ADS] [CrossRef] [EDP Sciences] [Google Scholar]
- Papaj, J., Krełowski, J., & Wegner, W. 1993, A&A, 273, 575 [NASA ADS] [Google Scholar]
- Pineau des Forêts, G., Roueff, E., & Flower, D. R. 1986, MNRAS, 223, 743 [NASA ADS] [CrossRef] [Google Scholar]
- Rachford, B. L., Snow, T. P., Tumlinson, J., et al. 2002, ApJ, 577, 221 [NASA ADS] [CrossRef] [Google Scholar]
- Ramsay, D. A. 1952, J. Chem. Phys., 20, 1920 [NASA ADS] [CrossRef] [Google Scholar]
- Schild, R. E., Garrison, R. F., & Hiltner, W. A. 1983, ApJS, 51, 321 [NASA ADS] [CrossRef] [Google Scholar]
- Senekowitsch, J., Werner, H. J., Rosmus, P., Reinsch, E. A., & ONeil, S. V. 1985, J. Chem. Phys., 83, 4661 [NASA ADS] [CrossRef] [Google Scholar]
- Sota, A., Maíz Apellániz, J., Morrell, N. I., et al. 2014, ApJS, 211, 10 [NASA ADS] [CrossRef] [Google Scholar]
- Walker, G. A. H. 1963, MNRAS, 125, 141 [NASA ADS] [Google Scholar]
- Ubachs, W., ter Meulen, J. J., & Dymanus, A. 1983, Chem. Phys. Lett., 101, 1 [NASA ADS] [CrossRef] [Google Scholar]
- Zhao, D., Galazutdinov, G. A., Linnartz, H., & Krełowski, J. 2015, ApJ, 805, L12 [NASA ADS] [CrossRef] [Google Scholar]
All Tables
All Figures
|
Fig. 1 Spectra of the SH A |
| In the text | |
|
Fig. 2 a) Ti II 3242 and 3384 Å lines in our averaged spectrum; b) the difference spectrum of the two Ti II lines in a). For a direct comparison, the two Ti II lines in panel a) are shifted to the radial velocity frame, and the central absorption depth of the 3384 Å line is normalized to that of the 3242 Å line. The two absorption features of SH we identified are marked by vertical dashed lines. |
| In the text | |
Current usage metrics show cumulative count of Article Views (full-text article views including HTML views, PDF and ePub downloads, according to the available data) and Abstracts Views on Vision4Press platform.
Data correspond to usage on the plateform after 2015. The current usage metrics is available 48-96 hours after online publication and is updated daily on week days.
Initial download of the metrics may take a while.