Fig. 6
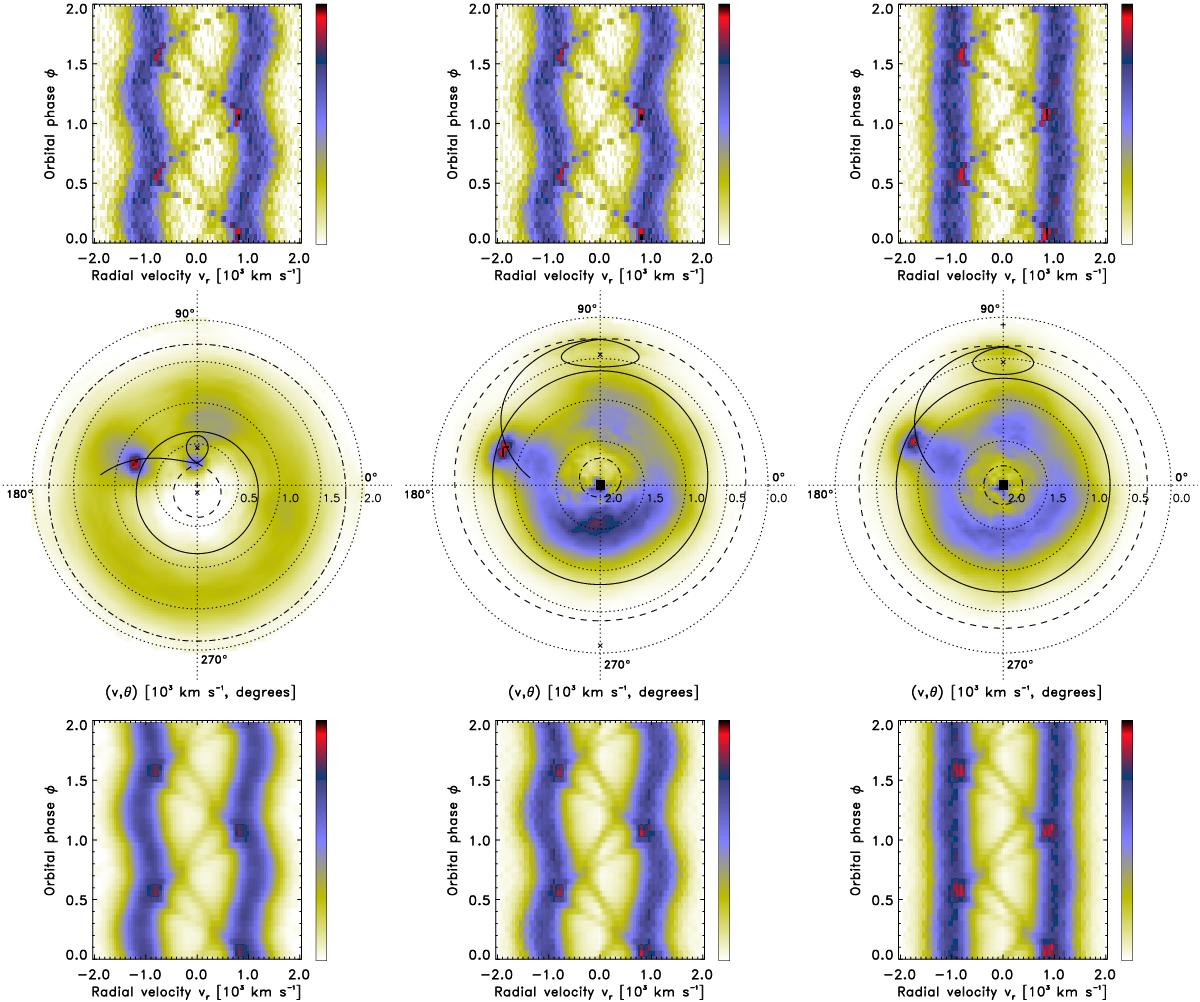
Doppler tomography of synthetic spectra. The standard tomogram and two inside-out tomograms (with the anti-C.O.M. of the binary and of the primary at the origin, respectively) are shown from left to right in the middle panels for comparison (see text for full description). The top and bottom panels show the input and reconstructed trailed spectra, respectively, for the corresponding tomogram.
Current usage metrics show cumulative count of Article Views (full-text article views including HTML views, PDF and ePub downloads, according to the available data) and Abstracts Views on Vision4Press platform.
Data correspond to usage on the plateform after 2015. The current usage metrics is available 48-96 hours after online publication and is updated daily on week days.
Initial download of the metrics may take a while.