Free Access
Fig. 2
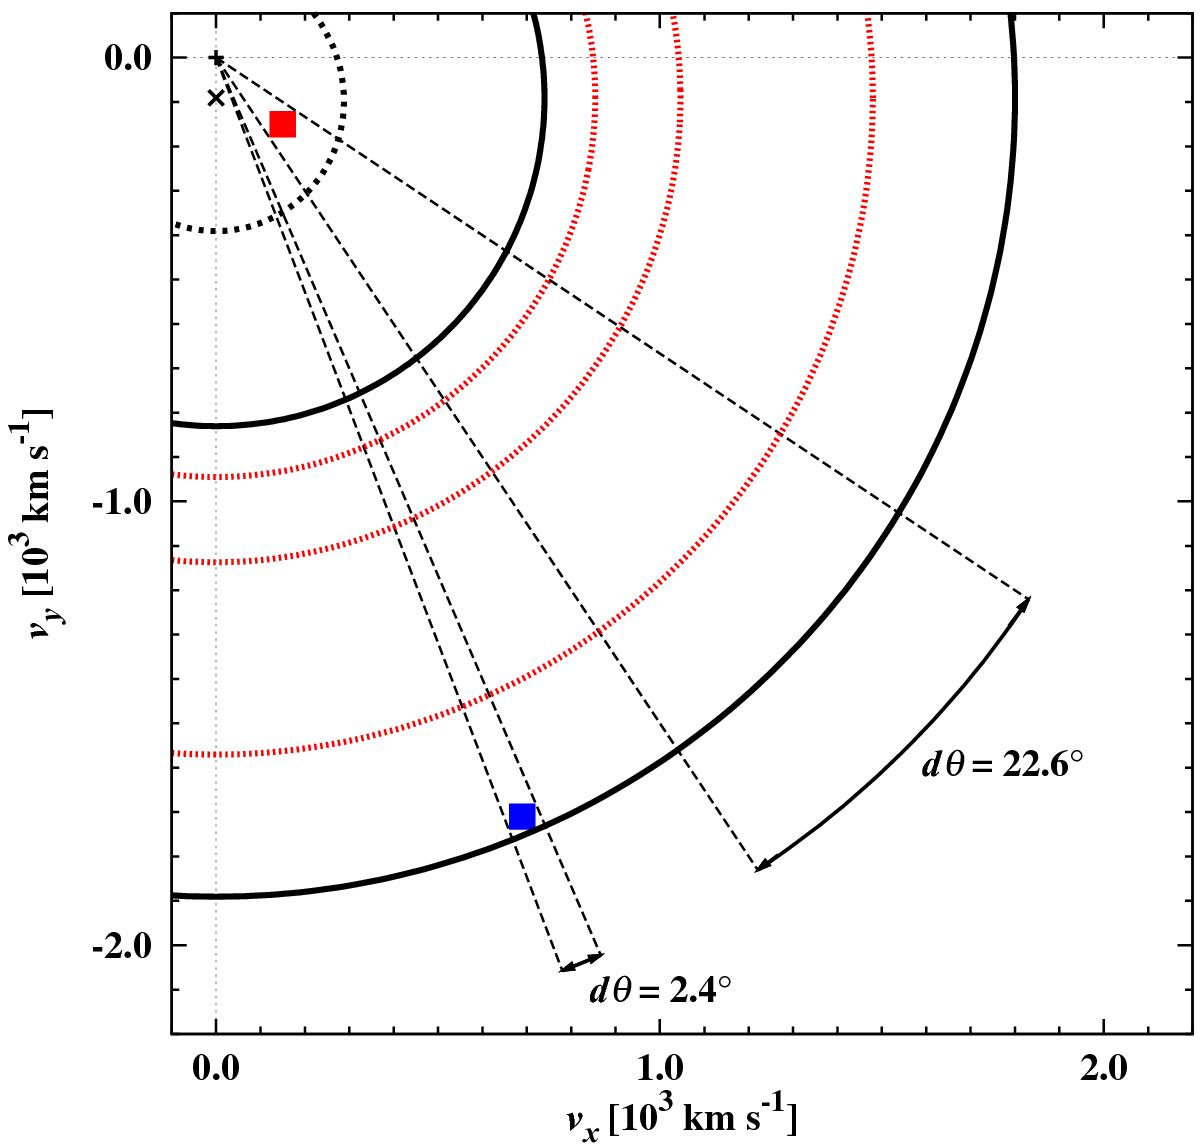
Velocity bins in the Cartesian velocity framework (i.e., in the lower right quadrant of the Doppler map in Fig. 1). The figure shows the positions of a lower and a higher velocity pixel (red and blue, respectively).
Current usage metrics show cumulative count of Article Views (full-text article views including HTML views, PDF and ePub downloads, according to the available data) and Abstracts Views on Vision4Press platform.
Data correspond to usage on the plateform after 2015. The current usage metrics is available 48-96 hours after online publication and is updated daily on week days.
Initial download of the metrics may take a while.