Fig. 3
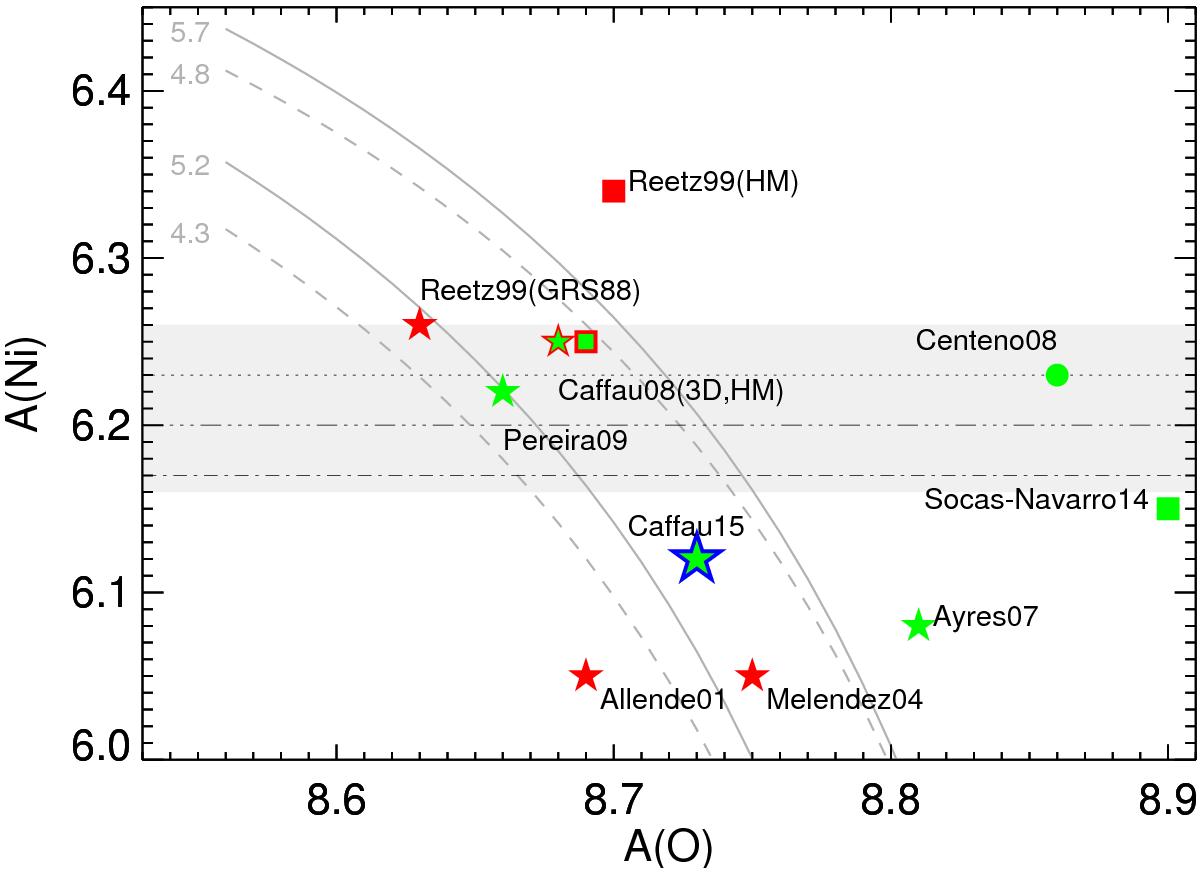
Oxygen and nickel abundances derived in the past years. The grey bar is the presently discussed range of the solar Ni abundance. Red symbols mean disc-integrated spectrum, green symbols disc centre. Stars indicate theoretical models, squares the HM model. The round dot of Centeno08: in the work a sun-spot spectrum is used. The dashed lines are lines of constant EW for disc centre, solid for disc-integrated light. This figure is an updated version of the one shown by Ludwig et al. (2010). The big green-blue star represents the result of this investigation. The horizontal dotted line at A(Ni) = 6.23 represents values from Grevesse & Sauval (1998); the horizontal dot-dashed line at A(Ni) = 6.17 the value from Scott et al. (2009); the horizontal dot-dashed line at A(Ni) = 6.20 the value from Scott et al. (2015).
Current usage metrics show cumulative count of Article Views (full-text article views including HTML views, PDF and ePub downloads, according to the available data) and Abstracts Views on Vision4Press platform.
Data correspond to usage on the plateform after 2015. The current usage metrics is available 48-96 hours after online publication and is updated daily on week days.
Initial download of the metrics may take a while.