Fig. 1
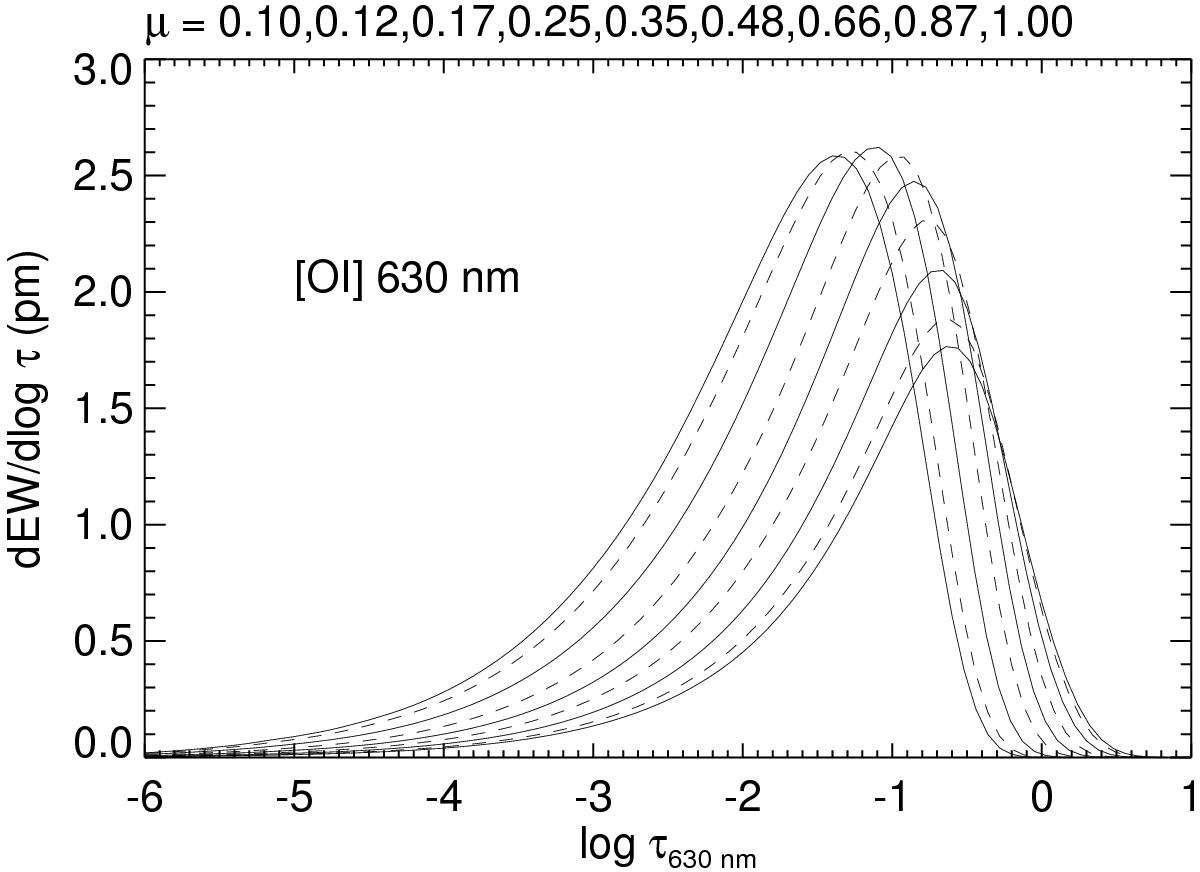
Contribution function of the EW of the pure [OI] 630 nm line for various μ-angles as a function of monochromatic optical depth in the continuum. The μ-values are given at the top of the panel, the curves are plotted alternating as solid and dashed lines. The ones peaking at higher optical depth correspond to higher μ-values.
Current usage metrics show cumulative count of Article Views (full-text article views including HTML views, PDF and ePub downloads, according to the available data) and Abstracts Views on Vision4Press platform.
Data correspond to usage on the plateform after 2015. The current usage metrics is available 48-96 hours after online publication and is updated daily on week days.
Initial download of the metrics may take a while.