Fig. 4
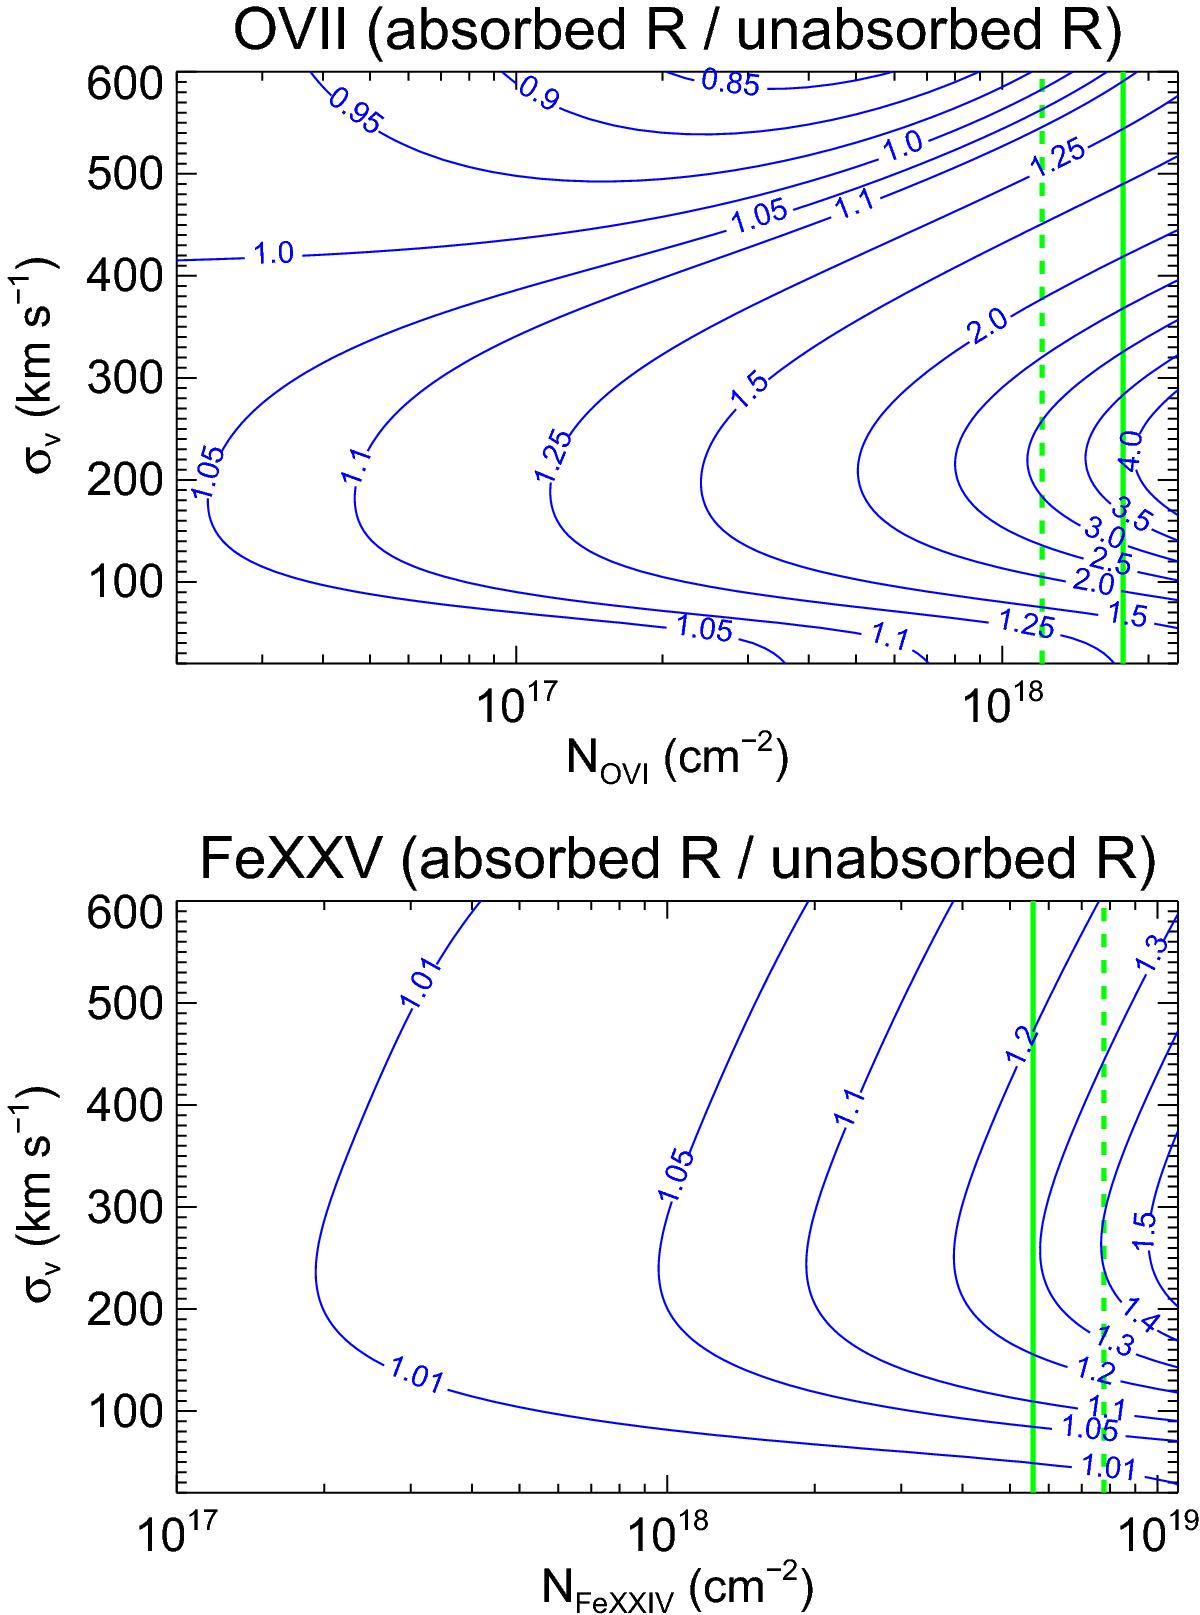
Absorbed R-ratio divided by the unabsorbed R-ratio for the O vii (top panel) and Fe xxv (bottom panel) triplets as a function of and σv. The contour lines show the factors by which the R-ratio value changes due to Li-like line absorption, including the effect of fluorescent emission. The green vertical lines in each panel indicate Ncrit, which is the critical Li-like ion column density limit corresponding to continuum optical depth τcont = 1 at the He-like triplet for PIE (solid vertical line) and CIE (dashed vertical line) plasma cases.
Current usage metrics show cumulative count of Article Views (full-text article views including HTML views, PDF and ePub downloads, according to the available data) and Abstracts Views on Vision4Press platform.
Data correspond to usage on the plateform after 2015. The current usage metrics is available 48-96 hours after online publication and is updated daily on week days.
Initial download of the metrics may take a while.