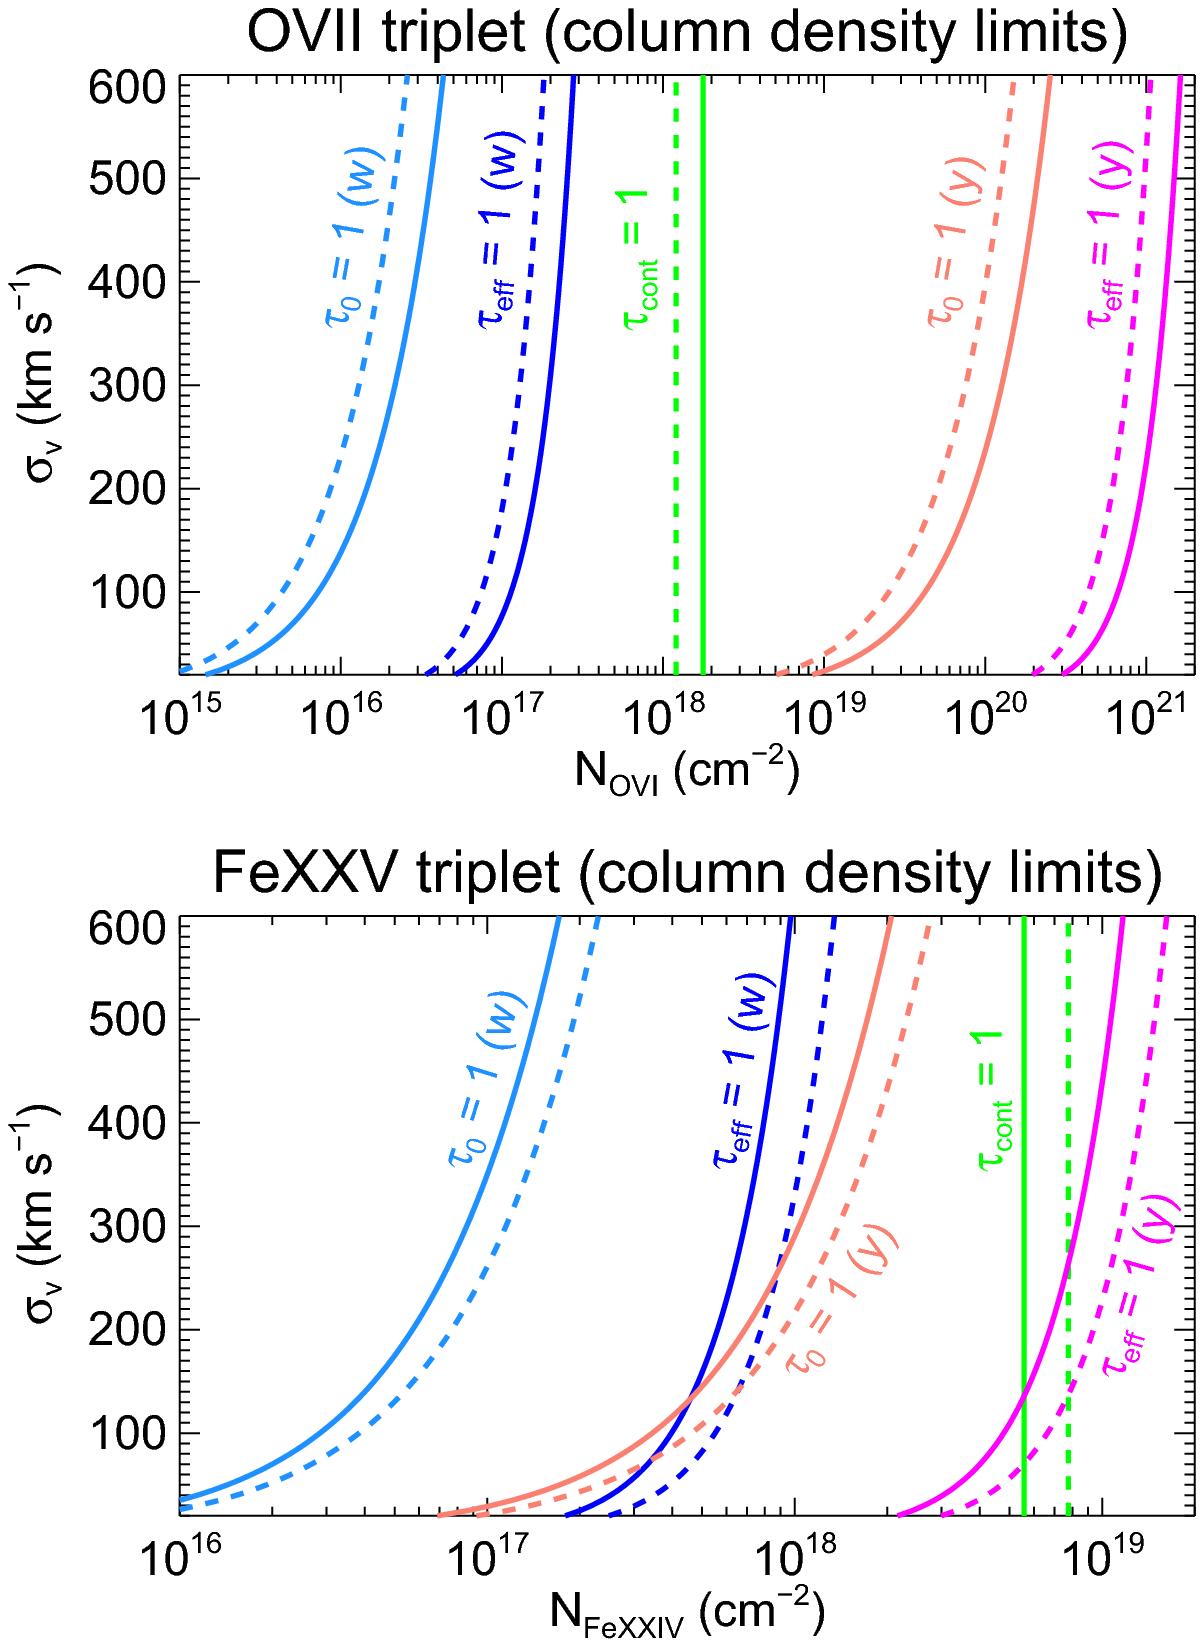
Fig. 3

Contour diagrams corresponding to τ0 = 1 and τeff = 1 limits for the resonance w and intercombination y line of O vii (top panel) and Fe xxv (bottom panel). The green vertical lines in each panel indicate Ncrit, which is the critical Li-like ion column density limit corresponding to continuum optical depth τcont = 1 at the He-like triplet. The dashed lines or curves are for the CIE plasma case, and the solid lines or curves are for the PIE plasma case as described in Sect. 3.1.
Current usage metrics show cumulative count of Article Views (full-text article views including HTML views, PDF and ePub downloads, according to the available data) and Abstracts Views on Vision4Press platform.
Data correspond to usage on the plateform after 2015. The current usage metrics is available 48-96 hours after online publication and is updated daily on week days.
Initial download of the metrics may take a while.


