Fig. 8
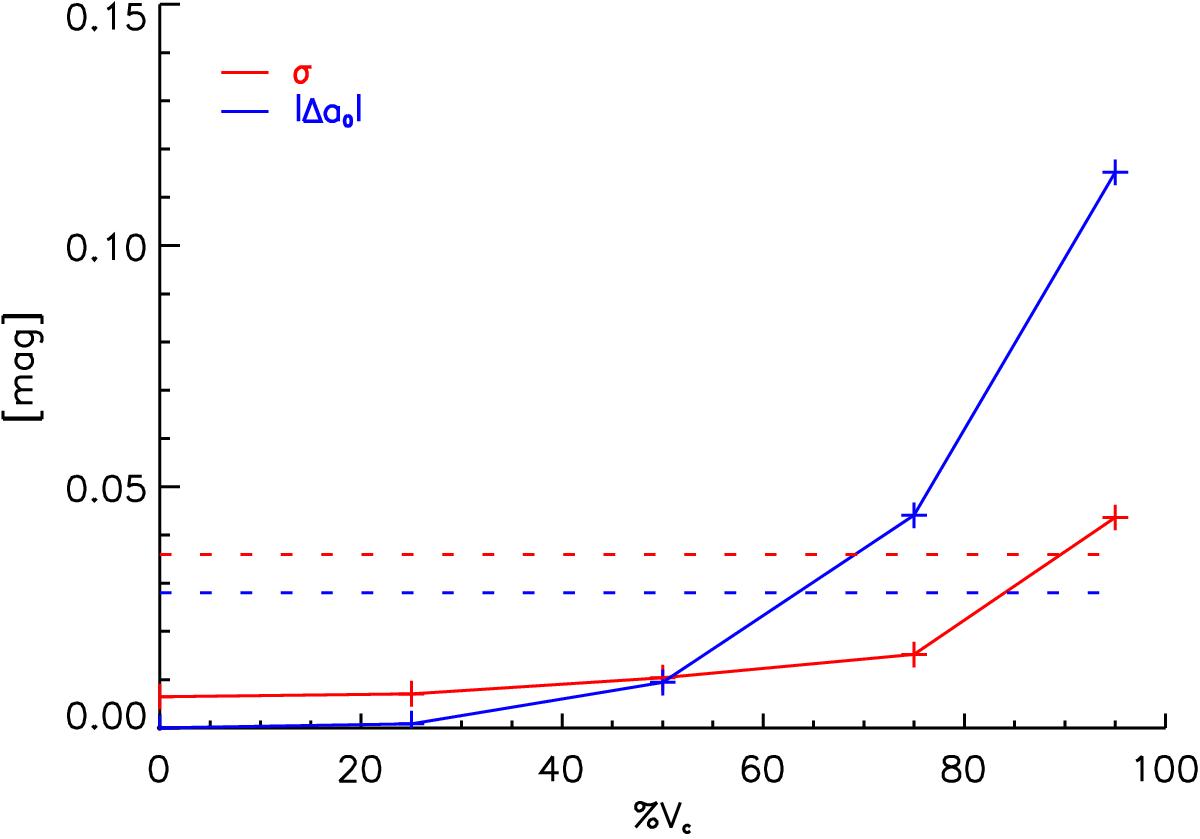
Relation between the rotational velocity (as a percentage of the critical rotational velocity) and (1) the shift in zero point (Δa0) of the SBCR (compared to the static relation) and (2) its dispersion (σ). The horizontal red (resp. blue) dotted lines correspond to the average σ (resp. Δa0) for the 150 models (see Table 3). All the quantities are derived using the C3 interferometric configuration.
Current usage metrics show cumulative count of Article Views (full-text article views including HTML views, PDF and ePub downloads, according to the available data) and Abstracts Views on Vision4Press platform.
Data correspond to usage on the plateform after 2015. The current usage metrics is available 48-96 hours after online publication and is updated daily on week days.
Initial download of the metrics may take a while.