Fig. 5
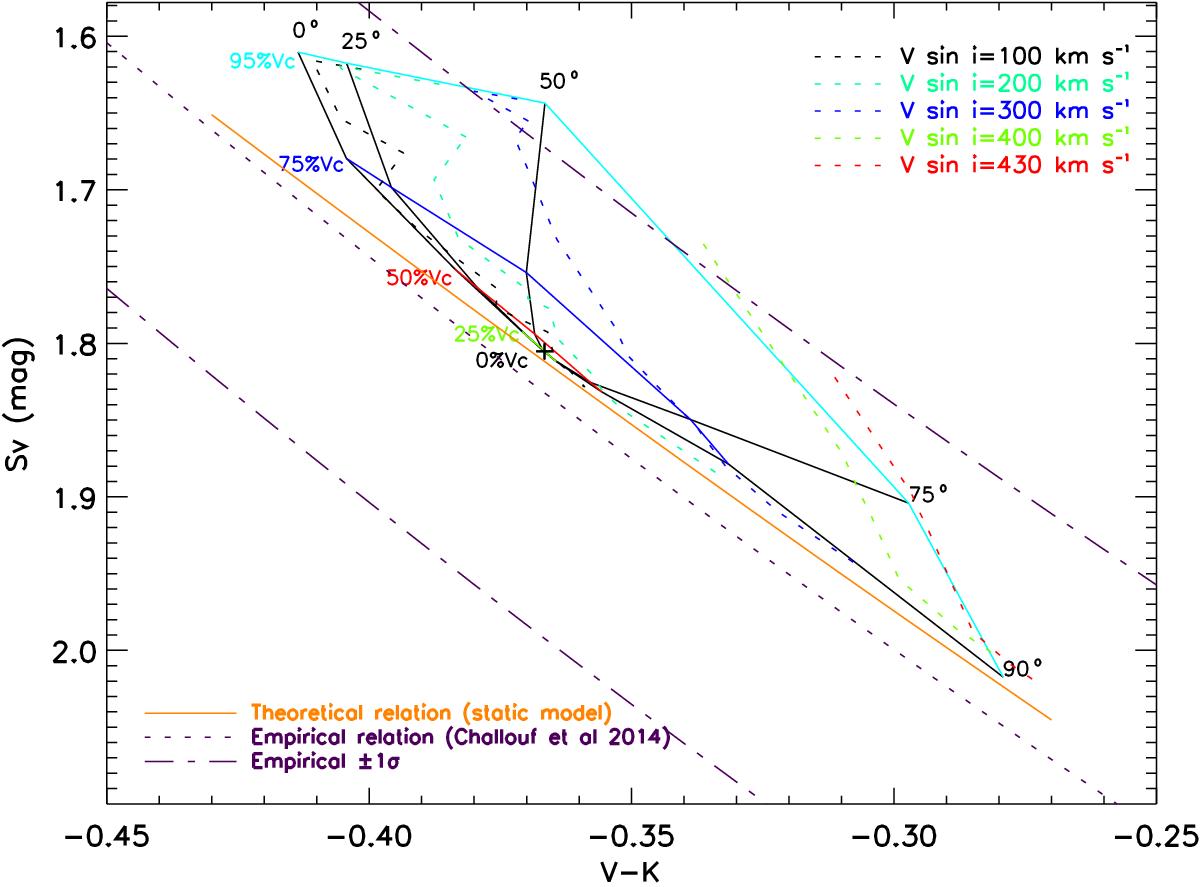
Surface brightness versus the V − K color for the M3 model (Table 1), considering the C3 interferometric configuration (Table 2). The rotational velocity of the star is indicated in percentage of the critical rotational velocity (Vc), together with the inclination angle (in degrees). The corresponding projected rotational velocity Vrotsini are also indicated by dotted lines. The orange solid line is the SBCR found for the static models (see next section). The violet dotted line is the empirical SBCR from Challouf et al. (2014b), together with its dispersion (red dot-dashed line).
Current usage metrics show cumulative count of Article Views (full-text article views including HTML views, PDF and ePub downloads, according to the available data) and Abstracts Views on Vision4Press platform.
Data correspond to usage on the plateform after 2015. The current usage metrics is available 48-96 hours after online publication and is updated daily on week days.
Initial download of the metrics may take a while.