Fig. 9
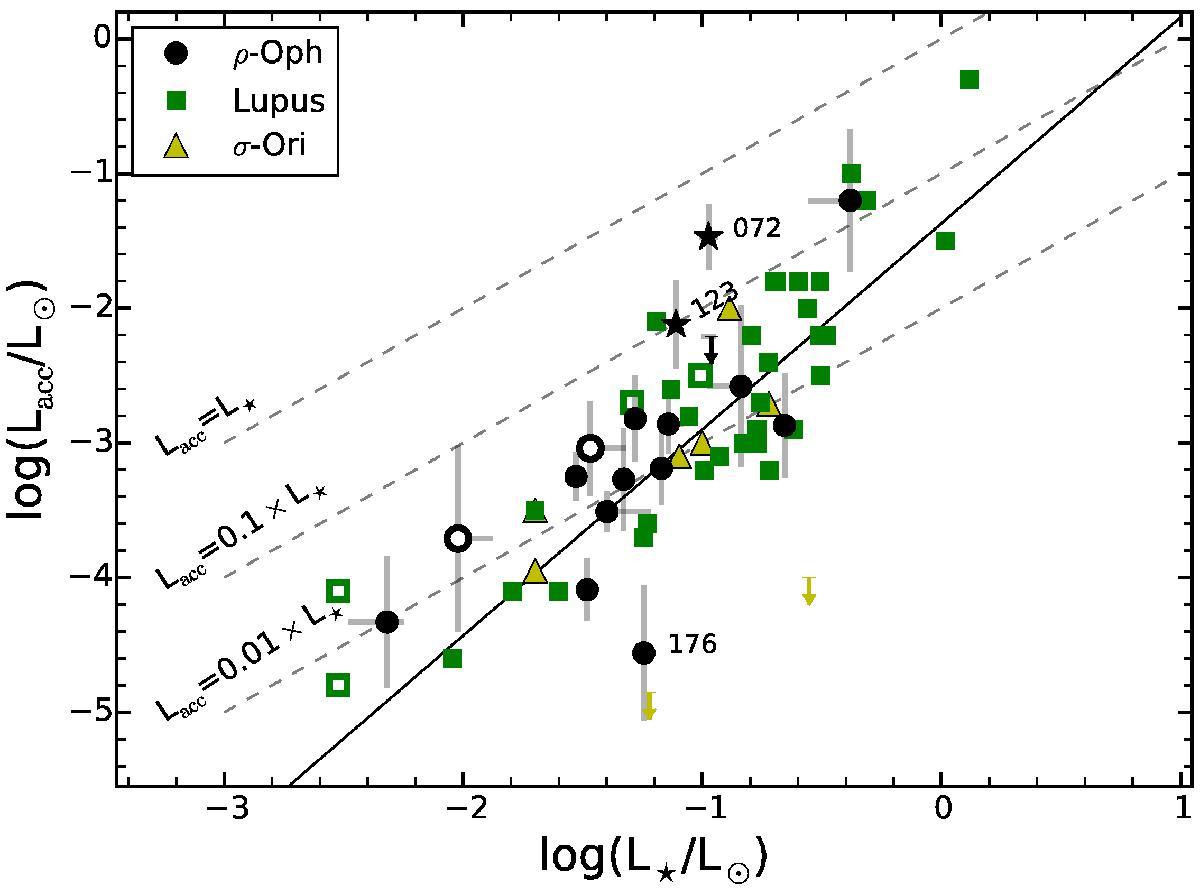
Accretion luminosity vs stellar luminosity for the whole ρ-Oph sample discussed here (black symbols), for the Lupus sample of Alcalá et al. (2014), reported with green symbols, and for a sample in σ-Ori studied by Rigliaco et al. (2012) and reported with yellow triangles. Upper limits are shown as downward arrows. Empty symbols are used for subluminous objects, and stars for strongly veiled objects. Dashed lines are for different Lacc/L⋆ ratios, going downward from 1, to 0.1, to 0.01, as labeled. The solid lines is the best fit for the GTO sample by Natta et al. (2014).
Current usage metrics show cumulative count of Article Views (full-text article views including HTML views, PDF and ePub downloads, according to the available data) and Abstracts Views on Vision4Press platform.
Data correspond to usage on the plateform after 2015. The current usage metrics is available 48-96 hours after online publication and is updated daily on week days.
Initial download of the metrics may take a while.