Fig. 8
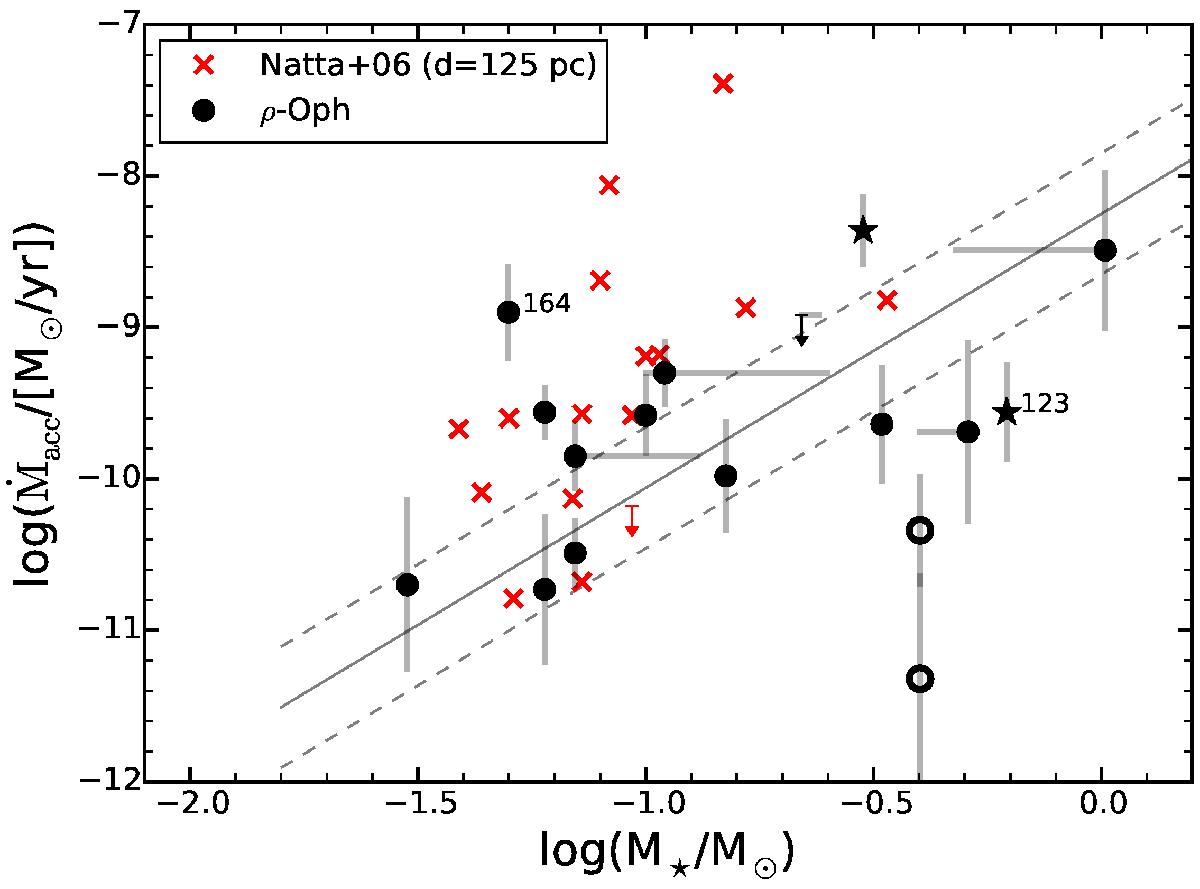
Mass accretion rate as a function of mass for the ρ-Oph sample. Values derived for the objects analyzed here are reported with black markers, values from N06 are shown with red symbols. Empty black circles are used for subluminous targets and downward arrows are used for upper limits. The continuous line represents the linear fit of this relation by Alcalá et al. (2014) for a sample of accreting objects in Lupus. The dashed lines represent the 1σ deviation from the fit.
Current usage metrics show cumulative count of Article Views (full-text article views including HTML views, PDF and ePub downloads, according to the available data) and Abstracts Views on Vision4Press platform.
Data correspond to usage on the plateform after 2015. The current usage metrics is available 48-96 hours after online publication and is updated daily on week days.
Initial download of the metrics may take a while.