Fig. 7
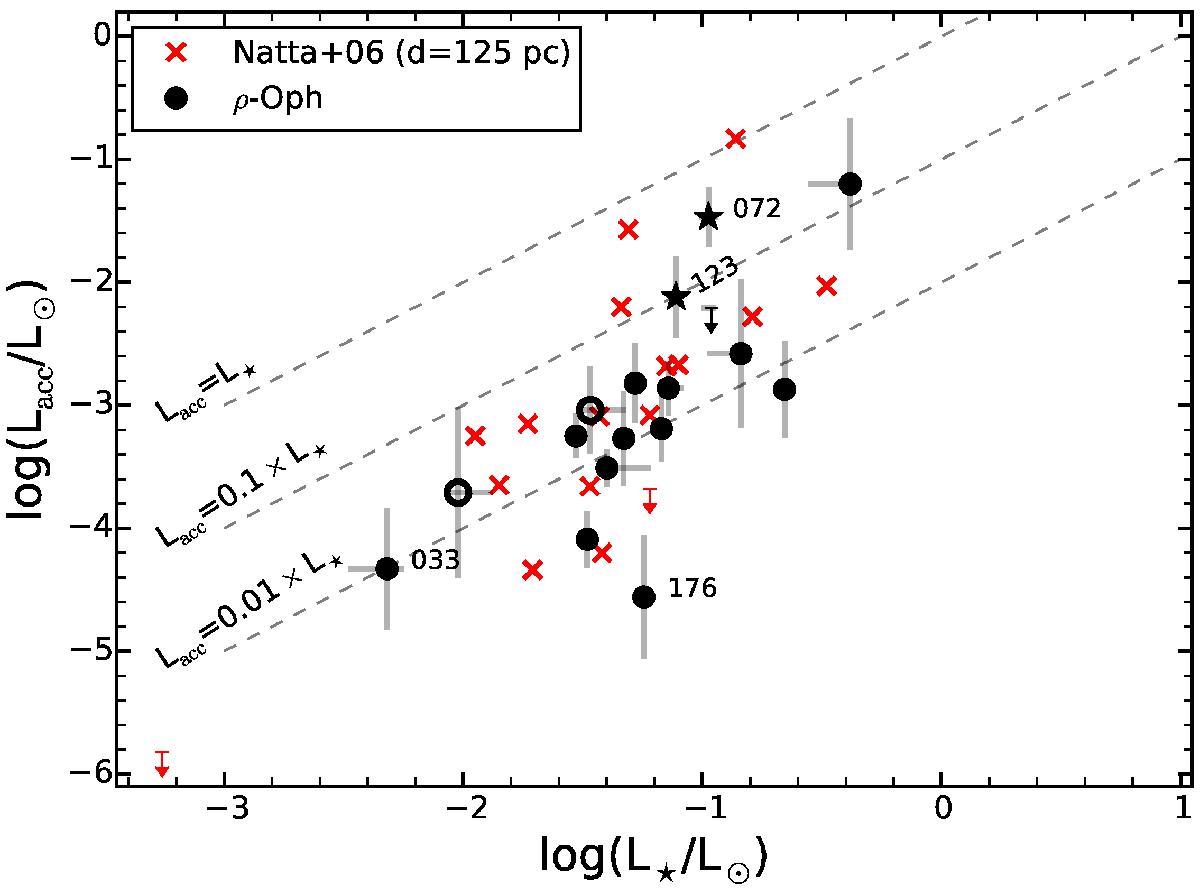
Comparison of accretion rate luminosity as a function of stellar luminosity for our sample with data from N06 for the same targets. Values from N06 are shown with red crosses, while our results with black circles. Empty black circles are used for subluminous targets and downward arrows for upper limits. Dashed lines are for different Lacc/L⋆ ratios, going downward from 1, to 0.1, to 0.01, as labeled. The object most to the left-hand side of the plot in both samples is ISO−Oph033.
Current usage metrics show cumulative count of Article Views (full-text article views including HTML views, PDF and ePub downloads, according to the available data) and Abstracts Views on Vision4Press platform.
Data correspond to usage on the plateform after 2015. The current usage metrics is available 48-96 hours after online publication and is updated daily on week days.
Initial download of the metrics may take a while.