Fig. 6
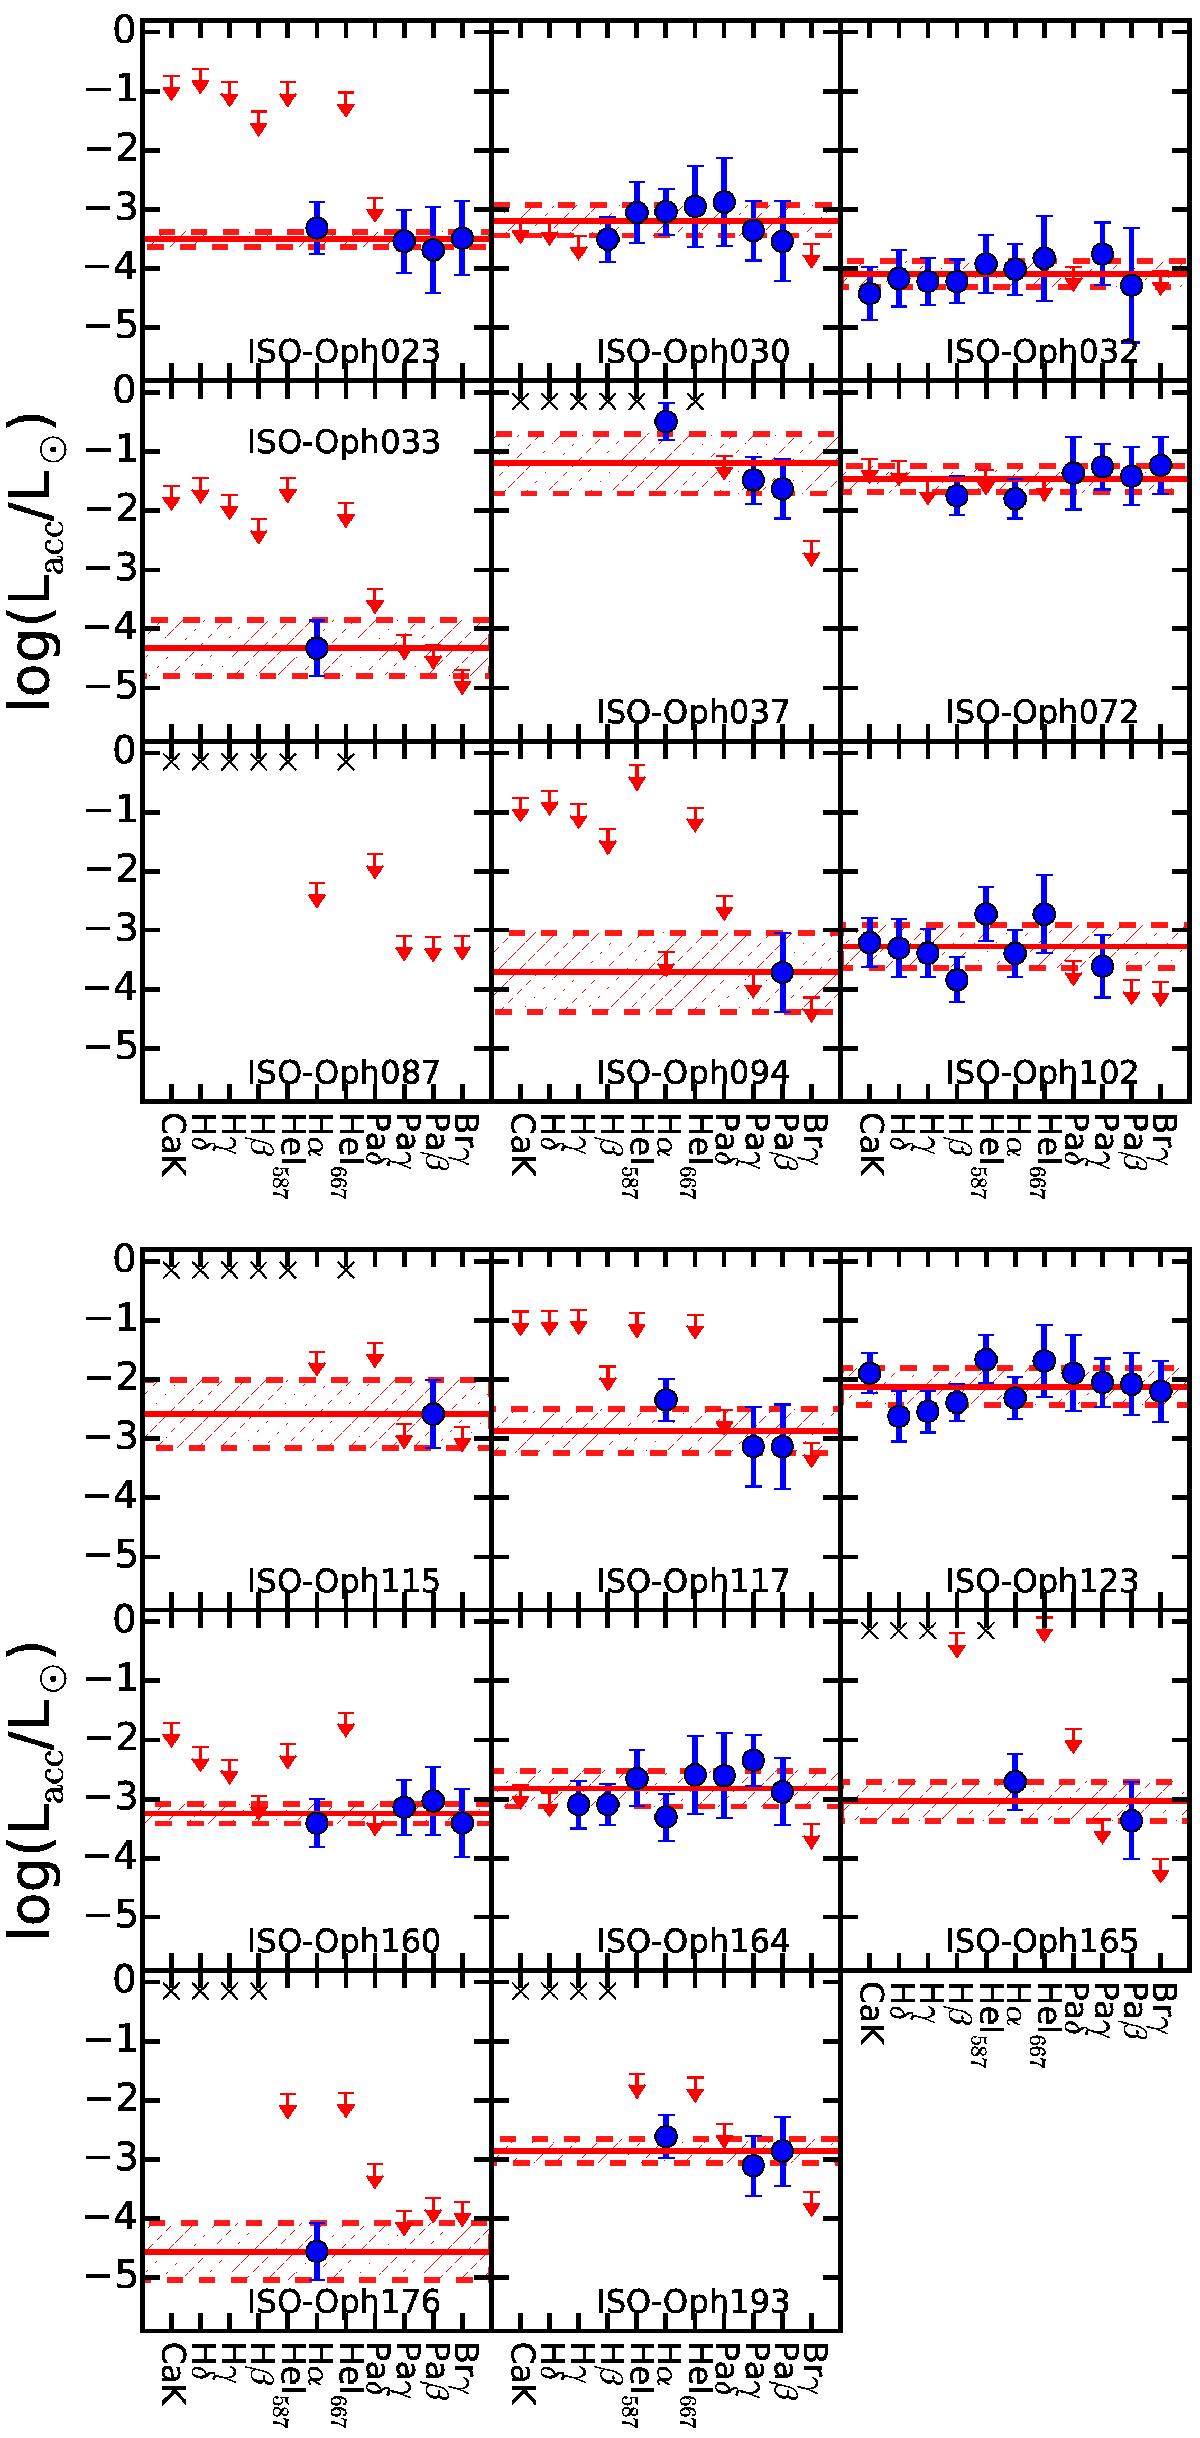
Accretion luminosity derived from various emission lines luminosity for the ρ-Oph targets. Each subplot shows the value of log (Lacc/L⊙) derived using the various indicators reported on the x-axis (CaK, Hδ, Hγ, Hβ, Heλ587nm, Hα, Heλ667nm, Paδ, Paγ, Paβ, Brγ) and in order of increasing wavelength. The red solid line is the average values obtained from the detected lines, while the dashed lines are the 1σ standard deviation of this value. Black crosses are for upper limits out of the range of the plot, i.e., larger than log (Lacc/L⊙) ~−0.1. As upper limits depend on the rms noise of the spectra, they are significantly higher than measurements when the S/N is low, in particular, in the UVB arm.

Current usage metrics show cumulative count of Article Views (full-text article views including HTML views, PDF and ePub downloads, according to the available data) and Abstracts Views on Vision4Press platform.
Data correspond to usage on the plateform after 2015. The current usage metrics is available 48-96 hours after online publication and is updated daily on week days.
Initial download of the metrics may take a while.