Fig. 4
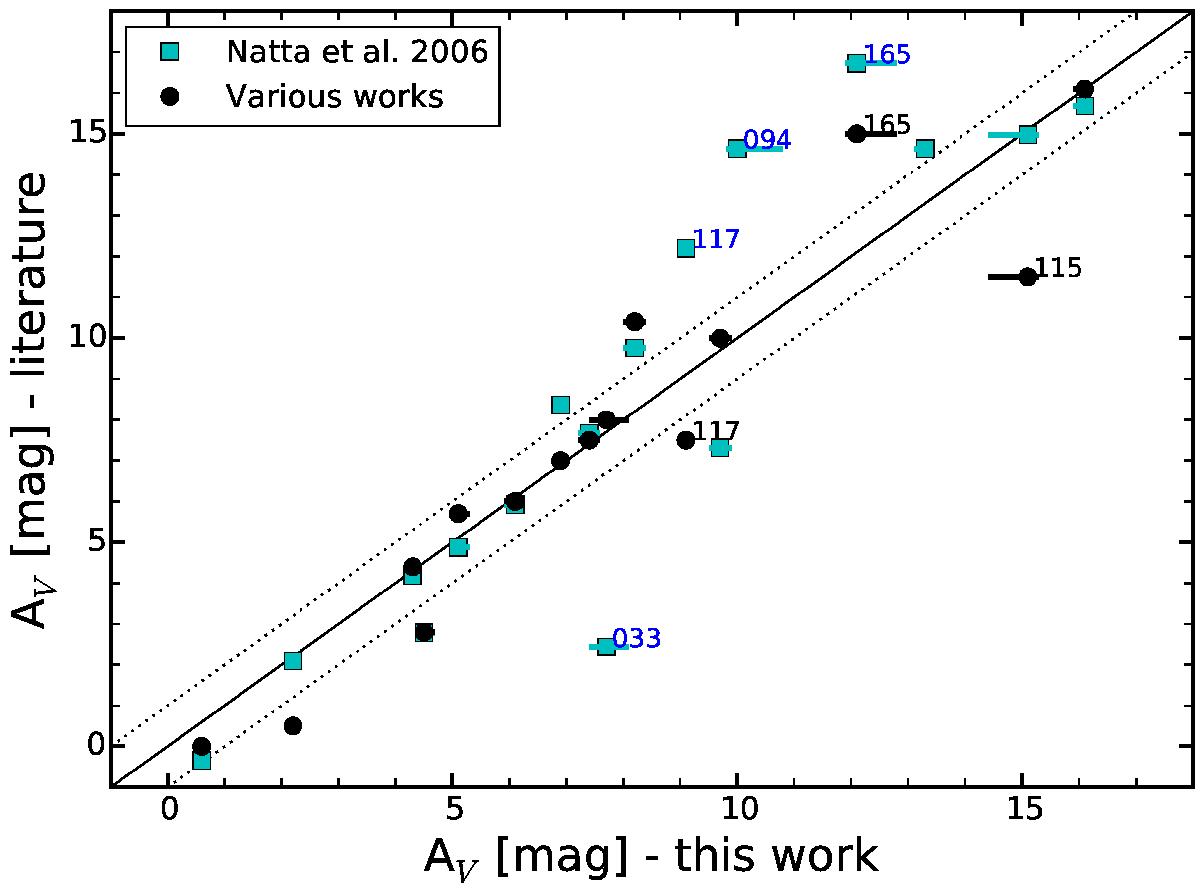
Comparison of the AV derived here for the targets (Sect. 3.2) with those reported in the literature. The latter are shown with cyan squares in the case of values derived by N06 and in black circles when from other works (see Table A.1 for the references). The dotted lines show the ±1 mag difference between the two values. One sigma uncertainties in our estimates are reported, and are sometimes smaller than the symbol.
Current usage metrics show cumulative count of Article Views (full-text article views including HTML views, PDF and ePub downloads, according to the available data) and Abstracts Views on Vision4Press platform.
Data correspond to usage on the plateform after 2015. The current usage metrics is available 48-96 hours after online publication and is updated daily on week days.
Initial download of the metrics may take a while.