Free Access
Fig. 1
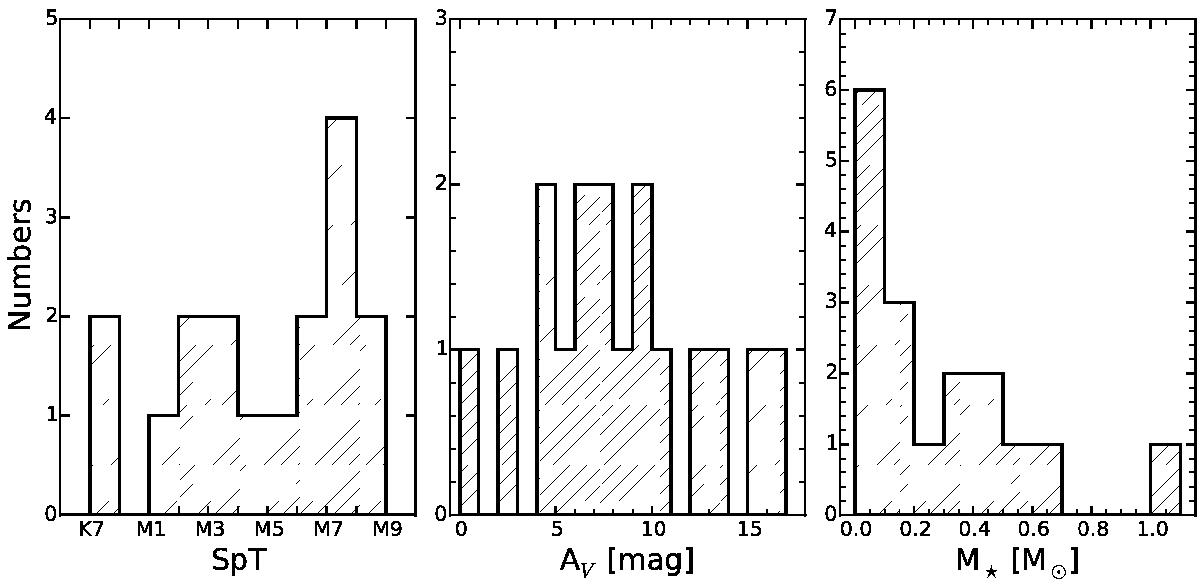
Histograms of the properties of the targets. The left-hand panel shows the SpTs, the middle panel shows the AV, and the right-hand panels shows the M⋆. According to M⋆ derived using Baraffe et al. (1998) evolutionary tracks, the sample comprises six BDs and two objects with mass just at the hydrogen-burning limit.
Current usage metrics show cumulative count of Article Views (full-text article views including HTML views, PDF and ePub downloads, according to the available data) and Abstracts Views on Vision4Press platform.
Data correspond to usage on the plateform after 2015. The current usage metrics is available 48-96 hours after online publication and is updated daily on week days.
Initial download of the metrics may take a while.