| Issue |
A&A
Volume 579, July 2015
|
|
|---|---|---|
| Article Number | A56 | |
| Number of page(s) | 10 | |
| Section | Astrophysical processes | |
| DOI | https://doi.org/10.1051/0004-6361/201526150 | |
| Published online | 26 June 2015 | |
Swift J1734.5-3027: a new long Type-I X-ray bursting source
1
ISDC Data Centre for Astrophysics, Chemin d’Ecogia 16,
1290
Versoix,
Switzerland
e-mail:
enrico.bozzo@unige.ch
2
INAF, Istituto di Astrofisica Spaziale e Fisica Cosmica – Palermo,
via U. La Malfa 153, 90146
Palermo,
Italy
3
International Space Science Institute,
Hallerstrasse 6, 3012
Bern,
Switzerland
4
International Space Science Institute in Beijing,
No. 1 Nan Er Tiao, Zhong Guan Cun,
100190
Beijing, PR
China
5
Institut de Ciències de l’Espai (IEEC-CSIC), Campus UAB, carrer de Can Magrans,
S/N 08193
Cerdanyola del Vallès, Barcelona, Spain
6
Center for Research and Exploration in Space Science and
Technology (CRESST) and NASA Goddard Space Flight Center, Greenbelt, MD
20771,
USA
7
Universities Space Research Association,
7178 Columbia Gateway Drive,
Columbia, MD
21046,
USA
Received: 21 March 2015
Accepted: 22 May 2015
Swift J1734.5-3027 is a hard X-ray transient discovered by Swift while undergoing an outburst in September 2013. Archival observations showed that this source underwent a previous episode of enhanced X-ray activity in 2013 May−June. In this paper we report on the analysis of all X-ray data collected during the outburst in 2013 September, the first that could be intensively followed up by several X-ray facilities. Our dataset includes INTEGRAL, Swift, and XMM-Newton observations. From the timing and spectral analysis of these observations, we show that a long Type-I X-ray burst took place during the source outburst, making Swift J1734.5-3027 a new member of the class of bursting neutron star low-mass X-ray binaries. The burst lasted for about 1.9 ks and reached a peak flux of (6.0 ± 1.8) × 10-8 erg cm-2 s-1 in the 0.5−100 keV energy range. The estimated burst fluence in the same energy range is (1.10 ± 0.10) × 10-5 erg cm-2. By assuming that a photospheric radius expansion took place during the first ~200 s of the burst and that the accreted material was predominantly composed by He, we derived a distance to the source of 7.2 ± 1.5 kpc.
Key words: X-rays: binaries / X-rays: individuals: Swift J1734.5-3027
© ESO, 2015
Log of the INTEGRAL data used in this paper.
1. Introduction
Swift J1734.5-3027 is a hard X-ray transient discovered by Swift on 2013 September 1 (Malesani et al. 2013). At discovery, the source spectrum could be reasonably well described in the Swift /BAT energy band (15−150 keV) by either a blackbody model with temperature kT = 2.5 ± 0.4 keV, or a power-law model with photon index Γ = 5.8 ± 0.7. A fluence of (1.6 ± 0.3) × 10-7 erg cm-2 was recorded during the initial ~27 s of the BAT trigger (Kennea et al. 2013). These spectral characteristics led Kennea et al. (2013) to suggest that Swift J1734.5-3027 was a new superbursting X-ray transient. The source outburst was also observed with the instruments on-board INTEGRAL, providing additional information on the source broad-band spectrum (Kuulkers et al. 2013). An archival search into previous Swift observations performed in the directions of Swift J1734.5-3027 showed that the source underwent a likely previous outburst in 2013 May−June (La Parola et al. 2013). Unfortunately, in that occasion no follow-up observations were performed.
In this paper, we report on all X-ray data collected from Swift J1734.5-3027 during its outburst in 2013 September. In addition to the data from the INTEGRAL and Swift monitoring, we also analyze a target of opportunity (ToO) observation that we obtained with XMM-Newton on 2013 September 8. From the timing and spectral analysis of these data, we show that Swift J1734.5-3027 is a new member of the transient bursting neutron star low-mass X-ray binaries (NSLMXBs) and that the BAT discovery of the source occurred during a long Type-I X-ray burst (rather than a superburst as suggested previously).
2. INTEGRAL data
Swift J1734.5-3027 was detected by INTEGRAL for the first time during the observations performed toward the Galactic bulge in the satellite revolution 1329, i.e., about half a day before the BAT discovery (from 56 535.85950 MJD to 56 536.01338 MJD; see Table 1). It remained within the field of view (FoV) of the instruments on-board INTEGRAL until satellite revolution 1348 (from 56 592.54664 MJD to 56 593.31612 MJD), when the window of seasonal visibility toward the Galactic center closed. We analyzed all INTEGRAL data by using version 10.1 of the Off-line Scientific Analysis software (OSA) distributed by the ISDC (Courvoisier et al. 2003). INTEGRAL observations are divided into science windows (SCWs), i.e., pointings with typical durations of ~2−3 ks. To limit the ISGRI calibration uncertainties (Lebrun et al. 2003), we made use of all public SCWs from the Galactic bulge, Scutum/Sagittarium, and Perseus/Norma monitoring programs during which the source was located to within 12 deg from the center of the IBIS FoV (Ubertini et al. 2003). We also included in our dataset the observations of the Galactic center and 4U 1728-34 for which our group was awarded data rights in revolutions 1329−1348. A summary of the total exposure-time available in each revolution is provided in Table 1 for IBIS/ISGRI and the two JEM-X telescopes (Lund et al. 2003). We extracted the mosaics and spectra in each revolution for the two JEM-X and ISGRI. All JEM-X spectra were extracted by using the standard 16-channel response matrix, while a customized 37 energy bin response matrix was created for ISGRI in order to optimize the signal-to-noise ratio (S/N) in the energy range (20−50 keV). Only in revolution 1329, was the ISGRI spectrum extracted with a reduced energy binning (8 channels), as the source was relatively faint (see Sect. 3). JEM-X lightcurves with a time resolution of 2 s were extracted from all observations to search for Type-I X-ray bursts, but none was found. We did not perform other timing analyses of the INTEGRAL data as the source was too faint to extract meaningful power spectra. In Fig. 1 we show the ISGRI mosaic realized by using all available data.
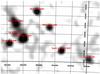 |
Fig. 1 INTEGRAL IBIS/ISGRI mosaiked image centered around the position of Swift J1734.5-3027. We used all available ISGRI data mentioned in Table 1 to build the mosaic (20−70 keV). The source is detected in this mosaic with a significance of 34σ. |
3. Swift data
3.1. XRT and BAT
Swift /XRT observations were carried out from 56 536.38578 MJD to 56 763.42292 MJD (see Table 4). XRT data were collected in both windowed-timing (WT) and photon-counting (PC) mode and analyzed by using standard procedures within FTOOLS (v6.16). The XRT data were processed with the xrtpipeline (v.0.13.1) and the latest calibration files available (20140730). PC source events were extracted in annular regions with outer radii ranging between 20 to 30 pixels (1 pixel ~2.36′′) depending on source intensity. When required, the PC data were corrected for pile-up. We determined the size of the point spread function (PSF) core affected by pile-up through a comparison between the observed and nominal PSF (see Vaughan et al. 2006). This sets the inner radius of the extraction region. WT source events were extracted in a circular region (20 pix radius), with the exception of observation 00569022000 during which the data were also affected by pileup; in the latter case an annular region (radii 2 and 20 pix) was adopted (see Romano et al. 2006). Background events were extracted in a circular regions with a radius of 70 pix for PC data and 20 pix for WT data. The xrtlccorr task was then used to account pile-up, PSF losses, and vignetting, in the light curves. All light curves were background subtracted. For our timing analysis we converted the event arrival times to the solar system barycenter with barycorr. For our spectral analysis, we extracted events in the same regions as those adopted for the light-curve creation; ancillary response files were generated with xrtmkarf, to account for different extraction regions, vignetting and PSF corrections. The data were rebinned with a minimum of 20 count per energy bin to allow χ2 fitting. We also made use of BAT data corresponding to the on-board trigger of the source. The BAT lightcurve and spectra were extracted by using the batgrbproduct tool available within Heasoft v. 6.16.
The best determined source position with XRT is found at: RA(J , Dec(J
 with an associated uncertainty of 1.̋4 (90% c.l.). This was obtained by using the online Swift “User Object” tools1, which uses field stars in the UVOT to determine the spacecraft attitude (Evans et al. 2009).
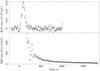 |
Fig. 2 BAT lightcurve corresponding to the on-board trigger at the onset of the outburst from Swift J1734.5-3027 (upper panel), together with the lightcurve extracted from the first available XRT observation performed after the Swift automatic slew in the direction of the source (ID. 00569022000). The time bin of both curves is 10 s. The start time (t = 0) is set at 56 536.38458 MJD. |
The BAT lightcurve corresponding to the on-board trigger is shown in Fig. 2, together with the first XRT follow-up observation performed after the automatic slew of the spacecraft (first orbit of the observation ID. 00569022000). The XRT lightcurve covering the entire source outburst is shown in Fig. 3. We note that the source rose in flux rapidly at the onset of the event and then decayed slowly up to 56 545 MJD. From 56 545 MJD to 56 571 MJD the source remained in a relatively low flux level before rising again in X-rays on 56 572 MJD. During the low-luminosity interval, an XMM-Newton ToO observation was carried out (see Sect. 4).
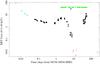 |
Fig. 3 XRT lightcurve of the entire outburst observed by Swift J1734.5-3027 (the start time is set at 56 536.38458 MJD as in Fig. 2 and the bin time is 500 s). The points in cyan represents the long Type-I X-ray burst. The red arrows show the XRT observations in which the source was not detected, providing an upper limit on the source count-rate. The green bands indicate the coverage of the outburst provided by INTEGRAL (data of revolution 1329 are not shown, as they were collected before the Swift discovery). We also indicated with a blue bar the time of the XMM-Newton ToO observation. |
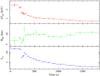 |
Fig. 4 Results of the time resolved spectral analysis carried out during the first part of the outburst decay. All spectra were fit with an absorbed blackbody model. We show in the three panels, from top to bottom, the blackbody temperature, radius, and the X-ray luminosity in units of 1037 erg s-1 for an assumed distance of 7.2 kpc (see Sect. 5.1). The luminosity has been computed from the source flux extrapolated in the 0.5−100 keV energy band (i.e., virtually bolometric for a blackbody spectral model with a temperature of ~3 keV) and corrected for absorption. The first point on the left is obtained from the fit to the BAT spectrum (in this case we also extrapolated the source flux in the 0.5−100 keV energy band; see Sect. 5.1). |
We extracted 19 XRT spectra for the first orbit of the XRT observation ID. 00569022000 collected in WT mode (total exposure time 1668 s; see Fig. 2). The integration time of these spectra ranged from a few up to 300 s, depending on the source flux during the burst decay (see Fig. 4). All 19 spectra could be well fit together by using an absorbed blackbody model ( /1863). We left the absorption column density free to vary in the fit but tied the value of this parameter to be the same for all spectra (NH = (0.84 ± 0.03) × 1022 cm-2). For comparison, we tested that a fit with an absorbed power-law model gave an unacceptable result (
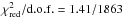 ). The results of this time resolved analysis are summarized in Fig. 4. We also show in Fig. 5 the quasi simultaneous spectrum obtained from the BAT trigger (exposure time 113 s centered around the peak of the event) and the XRT spectrum extracted during the first 60 s of the observation ID. 00569022000 (overlapping with the last part of the burst decay as detected by BAT; see Fig. 2). By fitting only the BAT spectrum extracted from the t = 0 in Fig. 2 until the beginning of the first XRT observation (exposure time 170 s), we obtained a blackbody temperature of kT = 2.5 ± 0.2 keV, a radius of
  d7.2kpc km, and a flux of (5.1 ± 0.5) × 10-9 erg cm-2 s-1 in the 15−50 keV energy range (corresponding to an extrapolated flux of (3.6 ± 0.4) × 10-8 erg cm-2 s-1 in the 0.5−100 keV energy range). The BAT spectrum extracted during the peak of the event (exposure time 1 s) gave instead
  ,
,  d7.2kpc km, and a 15−50 keV flux of (1.3 ± 0.4) × 10-8 erg cm-2 s-1. The latter would correspond to an extrapolated flux of (6.0 ± 1.8) × 10-8 erg cm-2 s-1 in the energy range 0.5−100 keV. Based on the spectral analysis and the flux evolution, we suggest in Sect. 5 that the event recorded by XRT during the observation ID. 00569022000 is a long Type-I X-ray burst of a NSLMXB. In Table 2 we report the most relevant properties of the burst.
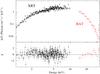 |
Fig. 5 Quasi-simultaneous XRT and BAT spectrum of the source at the onset of the outburst. The BAT spectrum is integrated for 113 s around the peak of the event, while the XRT spectrum is extracted from the first 30 s of the observation ID. 00569022000 (overlapping with the last part of the decaying BAT lightcurve; see Fig. 2). The best fit model is obtained with an absorbed blackbody model ( |

Parameters of the long Type-I X-ray burst.
The source X-ray spectra extracted from all the XRT data collected after the first orbit of the observation ID. 00569022000 could not be well fit by using an absorbed blackbody model. In all these cases, an absorbed power-law model provided a better description of the data (see Table 4). The power-law spectral index varied along the outburst from 1.6 to ~3, and there is some hint of a decrease in the absorption column density in the direction of the source from 1.5 × 1022 cm-2 to 0.8 × 1022 cm-2 during the latest available observations.
We searched all XRT data for possible coherent pulsations and/or quasi-periodic oscillations, but no significant feature was found. We obtained the most stringent upper limit on the detection of coherent modulations by using the XRT WT data from the observation ID. 00569022000. In this case we estimated a 3σ c.l. upper limit of 5.6% on the pulsed fraction of pulsations in frequency range 0.1−281 Hz (the pulsed fraction is defined as in Vaughan et al. 1994).
We used the quasi-simultaneous Swift observation ID. 00569022006 and INTEGRAL data collected in revolution 1330 to study the broad-band spectrum of the source at the later stages of the outburst. We fit together the XRT spectra in PC and WT mode, with the ISGRI and JEM-X spectra. The best fit could be obtained by using a simple absorbed power-law model (see Fig. 6). Normalization constants were included in the fit to take into account the inter-calibrations of the instruments and the source variability (data were not strictly simultaneous; see Tables 1 and 4). Taking advantage of the other quasi-simultaneous data, we also performed a similar broad-band spectral analysis by using: (a) INTEGRAL data from revolution 1345 and the Swift observation ID. 00032930017; (b) INTEGRAL data from revolution 1346 and the Swift observation ID. 00032930019; (c) INTEGRAL data from revolution 1348 and the Swift observation ID. 00032930021. In all cases a simple absorbed power-law provided a good fit to the data. All the results are reported in Table 3.
Log of all SwiftXRT observations use in this work.
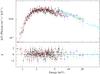 |
Fig. 6 Broad-band spectrum of Swift J1734.5-3027 obtained by using the XRT WT (red) and PC (black) spectra from the observation ID. 00569022006, together with the ISGRI (cyan) and JEM-X (green for JEM-X1 and blue for JEM-X2) data from revolution 1330. The best fit is obtained by using a simple absorbed power-law model. The residuals from the fit are reported in the bottom panel. |
All these spectra showed that the broad-band emission from the source was significantly harder during the later stages of the event compared to the peak of the outburst observed by BAT (that we interpreted as a long Type-I X-ray burst; see Sect. 5). To further confirm these findings, we extracted the ISGRI spectrum of the source from rev. 1329. This is the only INTEGRAL detection of the source before the BAT discovery. Although the source was relatively faint in the ISGRI energy band during rev. 1329, a sufficiently high S/N spectrum could be extracted by using reduced energy binning (8 channels). A fit to this spectrum gave a power-law photon index of 2.3 ± 0.7 and a 20−50 keV flux of 1.5 × 10⁻¹⁰ erg cm-2 s-1.
For completeness, we also reported in Fig. 7 the long-term BAT lightcurve of the source as retrieved from the BAT Transient Monitor web-page2 (Krimm et al. 2013). The lightcurve starts on MJD 56 352 (i.e., 2013 March 1). The outburst reported in this paper and the previous detection of Swift J1734.5-3027 in May−June 2013 are clearly visible. The latter detection was also discussed by La Parola et al. (2013). These authors confirmed that the BAT spectral index at that time was consistent with that measured by ISGRI before the onset of the bright event recorded in September 2013 and during the latest stages of such event (see Sects. 1 and 3.1). Unfortunately, no pointed XRT observations were performed in May−June 2013.
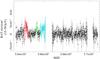 |
Fig. 7 Long-term BAT lightcurve of Swift J1734.5-3027 in the 15−50 keV energy range. The two outbursts of the source in May−June 2013 (red points) and September 2013 (green and cyan points) are clearly visible. For the outburst in September, we highlighted in green the initial part of the event up to the quiescent period around 56 545 MJD. The cyan points mark the re-brightening of the source after the quiescent period up to 56 614 MJD. Gaps in the BAT lightcurve are due to the source proximity to the Sun. |
3.2. UVOT
We also analyzed all available UVOT data that were collected simultaneously with the XRT observations. The analysis of the UVOT data was performed using the uvotimsum and uvotsource tasks included in the ftools software. The latter task performs aperture photometry on a single source based on user-supplied source and background regions3; we adopted circular regions of 5′′ and 10′′ for source and background, respectively. A faint source is found within the XRT error circle in the coadded UVOT u images (total exposure 5977 s). For this source we obtained a magnitude of u = 19.70 ± 0.12 mag. The best estimated UVOT position for this object is at RA(J , Dec(J
 with an uncertainty of 0.̋43 (90% c.l.). This is compatible at 2.4σ c.l. with the XRT position reported in Sect. 3.1 (assuming the XRT uncertainty in the position follows a Rayleigh distribution; Evans et al. 2014). Only poorly constraining upper limits could be obtained on the source magnitudes in the other UVOT filters. Owing to the lack of any detection of changes in magnitude of the UVOT source during the outburst and the marginal compatibility between the UVOT and XRT position, we are currently unable to firmly associate the counterpart identified in this section with Swift J1734.5-3027.
4. XMM-Newton data
An XMM-Newton (Jansen et al. 2001) observation of Swift J1734.5-3027 was carried out on 2013 September 8 for a total exposure time of 32.3 ks (from 56 543.1404 MJD to 56 543.5293 MJD). The EPIC-pn was operated in timing mode, the MOS1 in full frame and the MOS2 in small window. We reduced these data by using the SAS version 13.5 and the latest XMM-Newton calibrations files available4. The observation was not affected by intervals of high flaring background; we thus retained the entire exposure time available for the following analysis. As the source was found to be relatively faint (see later in this section) and centered on rawx=37, the EPIC-pn lightcurve and spectra were extracted in the energy range 0.6−12 keV from CCD columns 36 through 38 for the source and 3 through 15 for the background. For the two MOS cameras we used a circular source (background) extraction region with a radius of 600 (1800) pixels, corresponding to 30′′ (90′′). The average count-rate of the source as recorded by the EPIC-pn was (8.3 ± 0.2) × 10-2 cts s-1, thus too low to perform any count-rate and/or time resolved analysis. To improve the statistics, we used the task epicspeccombine to combine all EPIC spectra and fit them together (see Fig. 8).
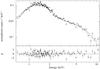 |
Fig. 8 XMM-Newton spectrum of Swift J1734.5-3027 obtained by summing up the Epic-pn, MOS1, and MOS2 data. The best fit model is obtained by using an absorbed power law plus a blackbody. The residuals from the fit are shown in the bottom panel. |
A fit to this spectrum with a simple absorbed power-law model gave an unacceptable result with  /d.o.f. = 1.88/111. The addition of a thermal blackbody component (bbodyrad in xspec) significantly improved the fit (/d.o.f. = 1.07/109). We measured an absorption column density of NH = (0.57 ± 0.08) × 1022 cm-2, a power-law photon index of Γ = 1.2 ± 0.3, a blackbody temperature of kT = 0.32 ± 0.03 keV, and a radius of
 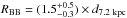 km. The average absorbed (unabsorbed) 0.5−10 keV X-ray flux measured from the spectral fit is 5.5 × 10⁻¹³ erg cm-2 s-1 (8.9 × 10⁻¹³ erg cm-2 s-1). This is consistent with the approximate measurement of the source flux obtained with XRT in the observations ID. 00032930001 and 00032930002 (see Table 4). The NH measured by XMM-Newton suggests that the absorption column density in the direction of the source might slightly decrease not only during the latest stages of the outburst, but also during the low X-ray luminosity period (unfortunately during this period we could not obtain a reliable NH measurement with XRT owing to the low statistics of the data; see Sect. 3).
We searched for possible coherent pulsations and/or quasi-periodic oscillations in the XMM-Newton data, but none was found (also owing to the very limited statistics). For coherent modulations, we estimated an upper limit of 13.5% at 3σ c.l. on the pulsed fraction of pulsations in the frequency range 0.1−1500 Hz.
For completeness, we checked for possible evidence of the soft thermal component detected by XMM-Newton in the XRT data collected close to 56 543 MJD. In the XRT observations ID 00032930001-00032930006 the source was not detected. We thus considered the observation ID. 00569022007, which was performed 2.4 days earlier than the XMM-Newton one and was characterized by a reasonably high statistics (see Table 4). The addition of a blackbody component to the source spectrum in this observation did not improve the fit. We thus fixed the temperature of this component to the one measured by XMM-Newton and determined a 90% c.l. upper limit on its normalization. We obtained RBB< 7 km (for an assumed distance of 7.2 kpc). This result suggests that the thermal emission revealed by XMM-Newton might have gone undetected during the earlier stages of the outburst due to the higher flux of the power-law component. We comment more on this result in Sect. 5.
5. Discussion
In this paper we report on all X-ray data collected during the first followed up outburst of the source Swift J1734.5-3027, which also led to its discovery. Shortly after the onset of the outburst, the source displayed a long Type-I X-ray burst that we discuss in detail later in this section. This allows us to firmly classify the source as a new member of the bursting NSLMXBs.
As noted in Sect. 3, the source showed a remarkable decay in flux after the onset of the outburst up to 56 539 MJD. At this epoch, the decay of the flux steepened dramatically and the source faded below the XRT detection limit on ~56 543 MJD (see Fig. 3). Such outburst profile is, in several respects, qualitatively similar to those observed from transient NSLMXBs. The outbursts of these systems typically last for a few weeks and are characterized by an initial exponential decay. At the later stages, a break is sometimes observed in the flux decay and a knee in the lightcurve marks the transition to a faster linear decaying phase that lasts until the source fades back into quiescence5 (see, e.g., Gilfanov et al. 1998; Gierliński & Zdziarski 2005; Falanga et al. 2005a,b, 2011, 2012). These outburst profiles are usually interpreted in terms of the disk instability model proposed by King & Ritter (1998). These authors showed that the X-ray heating during the decay from an outburst causes the light curves of a transient LMXBs to exhibit an exponential decay if the X-ray luminosity is sufficiently high to maintain the outer disk radius hot, or a linear decay at lower luminosities. This model was successfully applied to a number of observed LMXB outbursts by Powell et al. (2007), who also showed that the luminosity at which the knee occurs in the lightcurve and the exponential timescale of the outburst decay can be used to estimate the source outer disk radius. Indeed, it is believed that the matter supply to the NS is effectively cut-off after the knee, when the irradiation of the outer disk radius diminishes and the disk enters a cool low-viscosity state.
The peculiarity of the Swift J1734.5-3027 outburst profile is the presence of an apparently quiescent period extending from 56 545.6 MJD to at least 56 550.5 MJD that preceded a new rebrightening. During the quiescent period the source remained in a flux level that was too low to be detectable within the short XRT exposures (see Table 4). Stacking together the XRT observations ID. 00032930003, 00032930004, 00032930005, and 00032930006 a 3σ upper limit on the source count rate of 0.0049 cts s-1 is obtained, corresponding to an X-ray luminosity of 1.6 × 1033 erg s-1 (at 7.2 kpc, see below). As LMXBs in quiescence might have a luminosity as low as ≲1032 erg s-1, it is not possible to determine if Swift J1734.5-3027 really faded back into quiescence during this period or underwent an episode of very low mass accretion rate. Surprisingly, the source resumed its X-ray active state around 56 572 MJD. There was no coverage available with XRT for the period 56 550−56 572 MJD, but the INTEGRAL data show that the high-intensity state of the source did not resume before 56 565 MJD. The apparent low activity period in X-rays thus lasted about 15 days. At the beginning of the re-brightening phase the source recovered roughly the same X-ray luminosity displayed immediately after the long Type-I X-ray burst, and its broad-band X-ray spectrum was found to be fully compatible with that observed during most of the previous outburst. The mechanism that triggered this second episode of enhanced accretion is difficult to investigate due to the paucity of the data and the lack of coverage during the rise and the decay from this renewed activity. The last available XRT observation of Swift J1734.5-3027 was carried out on 56 763 MJD, i.e., about 169 days after the last detection of the source in the X-ray active phase, and thus we do not know precisely how long the second rebrightening phase lasted in time.
We note that a similar “double” outburst as described above was observed from the accreting millisecond X-ray pulsar (AMXP) IGR J00291+5934, which underwent two ~10 days long outbursts in 2008 separated by a quiescent period of ~30 days (Hartman et al. 2011). In this case, the first outburst followed the usual profile displaying a knee during the decay at a certain luminosity, while the second was characterized by a significantly slower rise and decay times. Owing to the presence of the second outburst, Hartman et al. (2011) questioned the applicability of the irradiated disk model to IGR J00291+5934. The main issue with this interpretation is that it predicts the disk around the NS to be heavily emptied after the first outburst and unable to power a second event without invoking an unlikely large variation in the mass flow rate from the companion star. The authors suggested that the knee during the decay of the first outburst could have been due to the onset of a propeller stage, during which accretion is (at least) partly inhibited due to the rapidly rotating NS magnetosphere (see, e.g., Illarionov & Sunyaev 1975; Romanova et al. 2014, and references therein). The inhibition of accretion would leave enough material in the disk after the first outburst to fuel a second event within a few days. As the condition for the onset of a propeller effect depends strongly on the NS magnetic field strength and rotational period, it is difficult to test this scenario in the case of Swift J1734.5-3027, for which neither the spin period nor its derivative are known (the NS magnetic field can be inferred from measurements of the spin period variations over time; see, e.g., Papitto et al. 2007, and references therein). Furthermore, it is worth noting that, although our understanding of the propeller regime is still far from complete, this effect is often involved to interpret more abrupt drops in luminosity (see, e.g., Ferrigno et al. 2014, for the recent case of the AMXP IGR J18245-2452).
The XMM-Newton spectrum of the source extracted during the faster portion of the first outburst decay (around 56 543 MJD) could not be well described by a simple absorbed power-all model, at odds with all previously collected XRT spectra. The XMM-Newton data revealed the presence of a predominant thermal component, which properties are compatible with those expected for an emitting hot spot on the NS surface (see Sect. 4). As discussed in Sect. 4, we could not firmly rule out the presence of this thermal component in the XRT data; if present, the thermal emission could have been likely hidden by the dominant comptonization component (i.e., the power-law due to the accretion). We thus conclude that during the latest stages of the first outburst, accretion was strongly suppressed and the emission from the NS surface emerged at the soft X-rays (≲2 keV). We are, however, currently unable to discriminate between a suppression of the accretion due to the disk turning into the low viscosity state or the onset of a mild propeller phase.
It is interesting to note that, at odds with a number of previously studied systems (Kuulkers et al. 2009), the long Type-I burst burst recorded by Swift J1734.5-3027 is unlikely to be the event triggering the overall outburst of the source. The INTEGRAL observations carried out in rev. 1329 already detected an enhanced X-ray activity from the source a few days before the onset of the long Type-I burst. This indicates that the NS was already accreting a substantial amount of matter at the time. We thus conclude that the outburst developed as a consequence of the disk instability, and it was the latter that paved the way for the long Type-I X-ray burst rather than the other way around. As bursts from Swift J1734.5-3027 were never detected before of the outburst in September 2013, it is unlikely that the source undergoes thermonuclear runaways during its quiescent state, as observed from the so-called burst-only sources (see, e.g., Cocchi et al. 2001). This would be expected according to the known stability of hydrogen burning via the pp-process or pycnonuclear reactions at low X-ray luminosities (Fushiki & Lamb 1987). Assuming a quiescent luminosity for Swift J1734.5-3027 of ~1033 erg s-1 (as estimated from the XRT observations and assuming a distance of ~7.2 kpc; see Sect. 5.1.2), it would take ~200 years to the source to accumulate the necessary fuel on the neutron star surface to emit a burst with a characteristic energy release of ~6.7 × 1040 erg (see Sect. 5.1.2). Therefore, it seems that Swift J1734.5-3027 gives rise to thermonuclear explosions only when it is accreting at luminosities ≳1035–1036 erg s-1and is thus a new member of the faint transient NSLMXBs exhibiting pure helium runaways when in outburst.
5.1. The long Type-I X-ray burst
From the time resolved spectroscopy and flux evolution of the Swift data collected on 2013 September 1, we argued that the event triggering the BAT on that day was due to a long Type-I X-ray burst from Swift J1734.5-3027. The time and spectral properties of the event are strikingly similar to those of the long burst from the NSLMXB XTE J1701-407 that triggered the BAT on 2008 July 17 (Falanga et al. 2009). We discuss the physical properties of the long burst from Swift J1734.5-3027 in the next three sections and use our observational findings to derive constraints on the distance to the source and the details of the accretion process.
5.1.1. Light curve and spectra
Our analysis of the XRT and BAT data presented in this paper revealed a long Type-I X-ray burst from Swift J1734.5-3027. This is the first discovered burst from the source. In Fig. 4, we showed the BAT (upper panel) and XRT (lower panel) light curve of the long Type-I X-ray burst. We set the burst start time at 56 536.38458 MJD, i.e., the time at which the BAT X-ray intensity of the source increased by 10% compared to its persistent intensity level. The XRT started observing the source about 170 s after the beginning of the burst detected by BAT. The BAT light curve exhibits a slow rise time6 of ≈50 s. The XRT decay time from the burst is best-fit by using two exponential functions with e-folding times of τ1 = 110 ± 8 s and τ2 = 1019 ± 85 s, respectively. A single exponential function could not provide an acceptable fit to the data. We note that the value 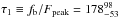 s reported in Table 2 is roughly consistent with the e-folding time estimated from the fit to the burst profile. Similar long Type-I X-ray bursts were so far recorded from the sources 2S 0918-549, SLX 1737-282, and XTE J1701-407 (in’t Zand et al. 2005; Falanga et al. 2008; Linares et al. 2008; Falanga et al. 2009). To compare the burst from Swift J1734.5-3027 with these previous results and with the decay cooling model proposed by Cumming & Macbeth (2004), we fitted the burst flux decay profile in Fig. 4 with a power-law, and found an index of Γ = −1.77 ± 0.02 with a
 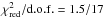 . This is comparable to the results found in the other cases. The total duration of the burst, i.e., the time to evolve away from and return to the persistent state, was of ≈200 s and ≈30 min in the BAT (15−25 keV) and the XRT (0.3−10 keV) lightcurves, respectively.
It is well known that X-ray bursts are produced by unstable burning of matter accreted on the surface of NSs and the X-ray emission released in this process can be described well as blackbody radiation with temperatures of a few keV. The energy-dependent decay time of the burst is regulated by the cooling of the NS photosphere, which results in a gradual softening of the burst spectrum (see, e.g., Lewin et al. 1993; Strohmayer & Bildsten 2006). The time-resolved spectral analysis of the burst recorded from Swift J1734.5-3027 was carried out by using BAT and XRT data in the 15−25 keV and 0.3–10 keV bands, respectively. Burst spectra could be described well by a simple photoelectrically-absorbed blackbody model (we measured NH = 0.84 × 1022 cm-2; see Table 2). The inferred blackbody temperature, apparent radius at 7.2 kpc (see below), and bolometric luminosity are reported in Fig. 4 and in Table 2. The burst fluence has been calculated from the bolometric fluxes (these correspond to the observed 0.3−10 keV XRT fluxes extrapolated to the 0.5−100 keV energy range). The peak flux of the burst was derived from the BAT spectrum extrapolated to the 0.5−100 keV energy range. All measured fluxes during the burst were extrapolated to the 0.5−100 keV band by generating dummy responses (XSPEC v12.8.2). This is justifiable for the XRT data since the blackbody temperature is well inside the spectral energy coverage. During the main peak of the burst, the blackbody temperature reaches a maximum in the energy range 2−3 keV (see, e.g., Falanga et al. 2008, and references therein), and thus the bolometric flux of the blackbody emission from the source is outside the BAT bandpass. However, as we detail below, this introduces uncertainties that are well within the estimated error on the bolometric flux measurements reported in Table 2. The best-fit blackbody temperature measured from the BAT spectrum extracted during the peak of the burst was keV. We fixed an upper and lower boundary blackbody temperature of 2.7 and 3.5 keV, respectively, the normalization remaining as a free parameter. The lower boundary for the temperature is chosen to be higher than the temperature measured during the XRT data collected close to the peak of the burst (see Fig. 4). For the upper boundary, we assumed that kT ~ 3.5 keV is a reasonably high value for the blackbody temperature at the peak of the event based on previous observations of long bursts from LMXBs (see, e.g., Molkov et al. 2005; Chenevez et al. 2006, 2007; Falanga et al. 2008, 2009). In the two cases, we found extrapolated fluxes of 4.4 × 10⁻⁸ erg cm-2 s-1 and 7.0 × 10⁻⁸ erg cm-2 s-1. These are well within the boundary of the peak flux uncertainties reported in Table 2. We note that a similar procedure was applied to extrapolate the peak flux of the burst in the case of XTE J1701-407 (Falanga et al. 2009).
5.1.2. Source distance, persistent flux, and accretion rate
In photospheric-radius expansion (PRE) bursts, the source distance can be determined based on the assumption that the bolometric peak luminosity is saturated at the Eddington limit (LEdd; e.g., Lewin et al. 1993; Kuulkers et al. 2003). During the PRE episode, the bolometric luminosity remains virtually constant at the Eddington value, while the high energy flux displays a typical double-peak profile and/or a delay in the rise time (e.g., Kuulkers et al. 2002; Galloway & Cumming 2006; Falanga et al. 2007, 2008).
In the case of Swift J1734.5-3027, the BAT lightcurve shows a slow rise time of ≈50 s, which is typically observed at the hard X-rays long Type-I helium bursts with PRE (e.g., Kuulkers et al. 2002; Molkov et al. 2005; Falanga et al. 2008). However, the XRT observation started about 170 s after the peak of the event, and thus we cannot firmly assess if this burst underwent a PRE. The time-resolved spectral analysis of the BAT data could not provide sufficient indications to solve this issue owing to the limited statistics (see Fig. 2). From the comparison between the burst from Swift J1734.5-3027 with other PRE bursts exhibiting a similar slow rise time at high energies, we assume in the following that Swift J1734.5-3027 underwent a PRE during the first ≈200 s of the event. This should correspond to the timescale that is needed by the photosphere to fall back onto the NS surface (see discussion in Falanga et al. 2009). Under these assumptions and considering a bolometric peak luminosity equal to the Eddington value for a He Type-I X-ray burst (LEdd ≈ 3.8 × 1038 erg s-1, as empirically derived by Kuulkers et al. 2003), we obtain a source distance for Swift J1734.5-3027 of d = 7.2 ± 1.5 kpc. We note that the source would be closer if the peak luminosity of the burst were lower than the pure-helium Eddington limit, or if a solar composition (X0 = 0.7) is assumed for the accreted material (in this case the source distance would be ≈6 kpc). In the following, we consider d ≈ 7.2 kpc as a fiducial distance.
In the case of Swift J1734.5-3027, an estimate of the persistent emission immediately before the onset of the long Type-I burst was not available (see Sect. 3). We thus assume as the pre-burst persistent emission, the flux measured in the closest XRT observation (i.e., the PC data in observation ID. 00569022000). In these data, the X-ray emission from Swift J1734.5-3027 was found to be well described by a simple power-law model with Γ ≈ 2.4. Assuming a distance of 7.2 kpc, the estimated long Type-I burst persistent unabsorbed flux in the energy range 0.5−100 keV is thus Fpers ≈ 5.2 × 10⁻¹⁰ erg cm-2 s-1, translating into a bolometric luminosity of Lpers ≈ 3.3 × 1036 erg cm-2 s-1, i.e., ≈1.0%LEdd. We can estimate the local accretion rate per unit area as Lpers = 5.4πR2ṁ(GM/R)/(1 + z), or 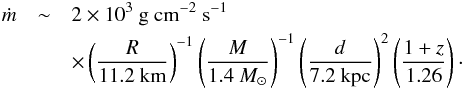 (1)A convenient unit of accretion rate is the Eddington rate. Here, we define the local Eddington accretion rate to be ṁEdd ≡ 1.8 × 10⁵ g cm-2 s-1, which corresponds to the local accretion rate of a NS of mass M = 1.4 M⊙ and radius R = 11.2 km that has a luminosity equal to the Eddington value 3.8 × 1038 erg s-1 (Kuulkers et al. 2003). We thus conclude that ṁ/ṁEdd ~ 1%.
5.1.3. Energy, ignition depth, and recurrence time of the burst
The released energy measured during the long-burst allows us to estimate the ignition depth and derive predictions on the burst recurrence time. The measured fluence of the burst, fb = 1.1 × 10⁻⁵ erg cm-2, corresponds to a net burst energy release of Eburst = 4πd2fb = 6.7 × 1040 erg (d/ 7.2 kpc)2. The ignition depth is related to the energy release during the burst by the equation Eburst = 4πR2yignQnuc/ (1 + z), and thus 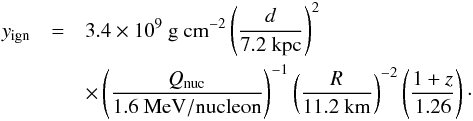 (2)The value of Qnuc ≈ 1.6 MeV/nucleon corresponds to the nuclear-energy release per nucleon for complete burning of helium to iron group elements. Including hydrogen with a mass-weighted mean mass fraction ⟨ X ⟩ provides a value of Qnuc ≈ 1.6 + 4 ⟨ X ⟩ MeV/nucleon (Galloway et al. 2004), where we included losses due to neutrino emission following Fujimoto et al. (1987). For ⟨ X ⟩ = 0.7, the solar composition value, Qnuc = 4.4 MeV/nucleon, and yign = 1.2 × 10⁹ g cm-2. At an accretion rate of 2 × 10³ g cm-2 s-1, the recurrence time corresponding to a column depth of yign = 3.4 × 10⁹ g cm-2 (pure helium composition) is Δt = (yign/ṁ)(1 + z) ~ 24 days, or for yign = 1.2 × 10⁹ g cm-2 (solar composition) is Δt ~ 9 days (independent from the assumed distance).
The long Type-I burst, which was the first observed burst from Swift J1734.5-3027, occurred about half a day after the first INTEGRAL detection of the source in rev. 1329 (starting from 56 535.85950 MJD). The outburst of the source was closely monitored only for the first 15 days, when the source first faded into a low luminosity state (see Sect. 3 and Fig. 3). The re-brightening of the source was observed starting from 56 565.5999 MJD, thus leaving a gap in the outburst coverage of about 15 days during which we do not have information on the X-ray emission from the source. The last useful XRT observation of the source during the re-brightening was carried out up to 56 594.46458 MJD, i.e., about 58 days from the detected long Type-I burst. According to our estimates above, the case Qnuc ≈ 1.6 MeV/nucleon would be slightly favoured by the data (as we did not observe a second Type-I X-ray burst), but the coverage of the outburst was far too sparse and limited in time to draw any firm conclusion.
In some cases, a linear decay in flux is observed directly after a stage in which the flux of the source is relatively stable for several weeks (see, e.g., Heinke et al. 2015; Campana et al. 2013).
Acknowledgments
E.B. thanks the New York University at Abu Dhabi for the kind hospitality during part of this work and Milvia Capalbi for her precious support during the analysis of some XRT observations. We thank Phil Evans for useful discussions. A.P. is supported by a Juan de la Cierva fellowship, and acknowledges grants AYA2012-39303, SGR2009-811, and iLINK2011-0303. P.R. acknowledges contract ASI-INAF I/004/11/0. We thank N. Schartel and the XMM-Newton team for having promptly performed the ToO observation analyzed in this paper. We are indebted to the Swift PI and operations team for the continuous support during the monitoring campaign of X-ray transients.
References
- Campana, S., Coti Zelati, F., & D’ Avanzo, P. 2013, MNRAS, 432, 1695 [NASA ADS] [CrossRef] [Google Scholar]
- Chenevez, J., Falanga, M., Brandt, S., et al. 2006, A&A, 449, L5 [NASA ADS] [CrossRef] [EDP Sciences] [Google Scholar]
- Chenevez, J., Falanga, M., Kuulkers, E., et al. 2007, A&A, 469, L27 [NASA ADS] [CrossRef] [EDP Sciences] [Google Scholar]
- Cocchi, M., Bazzano, A., Natalucci, L., et al. 2001, A&A, 378, L37 [NASA ADS] [CrossRef] [EDP Sciences] [Google Scholar]
- Courvoisier, T., Walter, R., Beckmann, V., et al. 2003, A&A, 411, L53 [NASA ADS] [CrossRef] [EDP Sciences] [Google Scholar]
- Cumming, A., & Macbeth, J. 2004, ApJ, 603, L37 [NASA ADS] [CrossRef] [Google Scholar]
- Evans, P. A., Beardmore, A. P., Page, K. L., et al. 2009, MNRAS, 397, 1177 [NASA ADS] [CrossRef] [Google Scholar]
- Evans, P. A., Osborne, J. P., Beardmore, A. P., et al. 2014, ApJS, 210, 8 [NASA ADS] [CrossRef] [Google Scholar]
- Falanga, M., Bonnet-Bidaud, J. M., Poutanen, J., et al. 2005a, A&A, 436, 647 [NASA ADS] [CrossRef] [EDP Sciences] [Google Scholar]
- Falanga, M., Kuiper, L., Poutanen, J., et al. 2005b, A&A, 444, 15 [NASA ADS] [CrossRef] [EDP Sciences] [Google Scholar]
- Falanga, M., Poutanen, J., Bonning, E. W., et al. 2007, A&A, 464, 1069 [NASA ADS] [CrossRef] [EDP Sciences] [Google Scholar]
- Falanga, M., Chenevez, J., Cumming, A., et al. 2008, A&A, 484, 43 [NASA ADS] [CrossRef] [EDP Sciences] [Google Scholar]
- Falanga, M., Cumming, A., Bozzo, E., & Chenevez, J. 2009, A&A, 496, 333 [NASA ADS] [CrossRef] [EDP Sciences] [Google Scholar]
- Falanga, M., Kuiper, L., Poutanen, J., et al. 2011, A&A, 529, A68 [NASA ADS] [CrossRef] [EDP Sciences] [Google Scholar]
- Falanga, M., Kuiper, L., Poutanen, J., et al. 2012, A&A, 545, A26 [NASA ADS] [CrossRef] [EDP Sciences] [Google Scholar]
- Ferrigno, C., Bozzo, E., Papitto, A., et al. 2014, A&A, 567, A77 [NASA ADS] [CrossRef] [EDP Sciences] [Google Scholar]
- Fujimoto, M. Y., Sztajno, M., Lewin, W. H. G., & van Paradijs, J. 1987, ApJ, 319, 902 [CrossRef] [Google Scholar]
- Fushiki, I., & Lamb, D. Q. 1987, ApJ, 323, L55 [NASA ADS] [CrossRef] [Google Scholar]
- Galloway, D. K., & Cumming, A. 2006, ApJ, 652, 559 [NASA ADS] [CrossRef] [Google Scholar]
- Galloway, D. K., Cumming, A., Kuulkers, E., et al. 2004, ApJ, 601, 466 [NASA ADS] [CrossRef] [Google Scholar]
- Gierliński, M., & Zdziarski, A. A. 2005, MNRAS, 363, 1349 [NASA ADS] [CrossRef] [Google Scholar]
- Gilfanov, M., Revnivtsev, M., Sunyaev, R., & Churazov, E. 1998, A&A, 338, L83 [NASA ADS] [Google Scholar]
- Hartman, J. M., Galloway, D. K., & Chakrabarty, D. 2011, ApJ, 726, 26 [NASA ADS] [CrossRef] [Google Scholar]
- Heinke, C. O., Bahramian, A., Degenaar, N., & Wijnands, R. 2015, MNRAS, 447, 3034 [NASA ADS] [CrossRef] [Google Scholar]
- Illarionov, A. F., & Sunyaev, R. A. 1975, A&A, 39, 185 [NASA ADS] [Google Scholar]
- in’tZand, J. J. M., Cumming, A., van der Sluys, M. V., Verbunt, F., & Pols, O. R. 2005, A&A, 441, 675 [NASA ADS] [CrossRef] [EDP Sciences] [Google Scholar]
- Jansen, F., Lumb, D., Altieri, B., et al. 2001, A&A, 365, L1 [NASA ADS] [CrossRef] [EDP Sciences] [Google Scholar]
- Kennea, J. A., Burrows, D. N., Cummings, J. R., et al. 2013, ATel, 5354, 1 [NASA ADS] [Google Scholar]
- King, A. R., & Ritter, H. 1998, MNRAS, 293, L42 [NASA ADS] [CrossRef] [Google Scholar]
- Krimm, H. A., Holland, S. T., Corbet, R. H. D., et al. 2013, ApJS, 209, 14 [NASA ADS] [CrossRef] [Google Scholar]
- Kuulkers, E., in’t Zand, J. J. M., van Kerkwijk, M. H., et al. 2002, A&A, 382, 503 [NASA ADS] [CrossRef] [EDP Sciences] [Google Scholar]
- Kuulkers, E., den Hartog, P. R., in’t Zand, J. J. M., et al. 2003, A&A, 399, 663 [NASA ADS] [CrossRef] [EDP Sciences] [Google Scholar]
- Kuulkers, E., in’t Zand, J. J. M., & Lasota, J.-P. 2009, A&A, 503, 889 [NASA ADS] [CrossRef] [EDP Sciences] [Google Scholar]
- Kuulkers, E., Eckert, D., Ferrigno, C., et al. 2013, ATel, 5361, 1 [NASA ADS] [Google Scholar]
- La Parola, V., Segreto, A., Cusumano, G., & Maselli, A. 2013, ATel, 5646, 1 [NASA ADS] [Google Scholar]
- Lebrun, F., Leray, J. P., Lavocat, P., et al. 2003, A&A, 411, L141 [NASA ADS] [CrossRef] [EDP Sciences] [Google Scholar]
- Lewin, W. H. G., van Paradijs, J., & Taam, R. E. 1993, Space Sci. Rev., 62, 223 [NASA ADS] [CrossRef] [Google Scholar]
- Linares, M., Wijnands, R., van der Klis, M., et al. 2008, ApJ, 677, 515 [NASA ADS] [CrossRef] [Google Scholar]
- Lund, N., Budtz-Jørgensen, C., Westergaard, N. J., et al. 2003, A&A, 411, L231 [NASA ADS] [CrossRef] [EDP Sciences] [Google Scholar]
- Malesani, D., Kennea, J. A., Burrows, D. N., et al. 2013, GRB Coordinates Network, 15172, 1 [Google Scholar]
- Molkov, S., Revnivtsev, M., Lutovinov, A., & Sunyaev, R. 2005, A&A, 434, 1069 [NASA ADS] [CrossRef] [EDP Sciences] [Google Scholar]
- Papitto, A., di Salvo, T., Burderi, L., et al. 2007, MNRAS, 375, 971 [NASA ADS] [CrossRef] [Google Scholar]
- Powell, C. R., Haswell, C. A., & Falanga, M. 2007, MNRAS, 374, 466 [NASA ADS] [CrossRef] [Google Scholar]
- Romano, P., Campana, S., Chincarini, G., et al. 2006, A&A, 456, 917 [NASA ADS] [CrossRef] [EDP Sciences] [Google Scholar]
- Romanova, M. M., Lovelace, R. V. E., Bachetti, M., et al. 2014, Eur. Phys. J. Web Conf., 64, 5001 [CrossRef] [EDP Sciences] [Google Scholar]
- Strohmayer, T., & Bildsten, L. 2006, in New views of thermonuclear bursts, eds. W. H. G. Lewin, & M. van der Klis, 113 [Google Scholar]
- Ubertini, P., Lebrun, F., Di Cocco, G., et al. 2003, A&A, 411, L131 [NASA ADS] [CrossRef] [EDP Sciences] [Google Scholar]
- Vaughan, B. A., van der Klis, M., Wood, K. S., et al. 1994, ApJ, 435, 362 [NASA ADS] [CrossRef] [Google Scholar]
- Vaughan, S., Goad, M. R., Beardmore, A. P., et al. 2006, ApJ, 638, 920 [NASA ADS] [CrossRef] [Google Scholar]
All Tables
All Figures
|
Fig. 1 INTEGRAL IBIS/ISGRI mosaiked image centered around the position of Swift J1734.5-3027. We used all available ISGRI data mentioned in Table 1 to build the mosaic (20−70 keV). The source is detected in this mosaic with a significance of 34σ. |
| In the text | |
|
Fig. 2 BAT lightcurve corresponding to the on-board trigger at the onset of the outburst from Swift J1734.5-3027 (upper panel), together with the lightcurve extracted from the first available XRT observation performed after the Swift automatic slew in the direction of the source (ID. 00569022000). The time bin of both curves is 10 s. The start time (t = 0) is set at 56 536.38458 MJD. |
| In the text | |
|
Fig. 3 XRT lightcurve of the entire outburst observed by Swift J1734.5-3027 (the start time is set at 56 536.38458 MJD as in Fig. 2 and the bin time is 500 s). The points in cyan represents the long Type-I X-ray burst. The red arrows show the XRT observations in which the source was not detected, providing an upper limit on the source count-rate. The green bands indicate the coverage of the outburst provided by INTEGRAL (data of revolution 1329 are not shown, as they were collected before the Swift discovery). We also indicated with a blue bar the time of the XMM-Newton ToO observation. |
| In the text | |
|
Fig. 4 Results of the time resolved spectral analysis carried out during the first part of the outburst decay. All spectra were fit with an absorbed blackbody model. We show in the three panels, from top to bottom, the blackbody temperature, radius, and the X-ray luminosity in units of 1037 erg s-1 for an assumed distance of 7.2 kpc (see Sect. 5.1). The luminosity has been computed from the source flux extrapolated in the 0.5−100 keV energy band (i.e., virtually bolometric for a blackbody spectral model with a temperature of ~3 keV) and corrected for absorption. The first point on the left is obtained from the fit to the BAT spectrum (in this case we also extrapolated the source flux in the 0.5−100 keV energy band; see Sect. 5.1). |
| In the text | |
|
Fig. 5 Quasi-simultaneous XRT and BAT spectrum of the source at the onset of the outburst. The BAT spectrum is integrated for 113 s around the peak of the event, while the XRT spectrum is extracted from the first 30 s of the observation ID. 00569022000 (overlapping with the last part of the decaying BAT lightcurve; see Fig. 2). The best fit model is obtained with an absorbed blackbody model ( |
| In the text | |
|
Fig. 6 Broad-band spectrum of Swift J1734.5-3027 obtained by using the XRT WT (red) and PC (black) spectra from the observation ID. 00569022006, together with the ISGRI (cyan) and JEM-X (green for JEM-X1 and blue for JEM-X2) data from revolution 1330. The best fit is obtained by using a simple absorbed power-law model. The residuals from the fit are reported in the bottom panel. |
| In the text | |
|
Fig. 7 Long-term BAT lightcurve of Swift J1734.5-3027 in the 15−50 keV energy range. The two outbursts of the source in May−June 2013 (red points) and September 2013 (green and cyan points) are clearly visible. For the outburst in September, we highlighted in green the initial part of the event up to the quiescent period around 56 545 MJD. The cyan points mark the re-brightening of the source after the quiescent period up to 56 614 MJD. Gaps in the BAT lightcurve are due to the source proximity to the Sun. |
| In the text | |
|
Fig. 8 XMM-Newton spectrum of Swift J1734.5-3027 obtained by summing up the Epic-pn, MOS1, and MOS2 data. The best fit model is obtained by using an absorbed power law plus a blackbody. The residuals from the fit are shown in the bottom panel. |
| In the text | |
Current usage metrics show cumulative count of Article Views (full-text article views including HTML views, PDF and ePub downloads, according to the available data) and Abstracts Views on Vision4Press platform.
Data correspond to usage on the plateform after 2015. The current usage metrics is available 48-96 hours after online publication and is updated daily on week days.
Initial download of the metrics may take a while.