Fig. 4
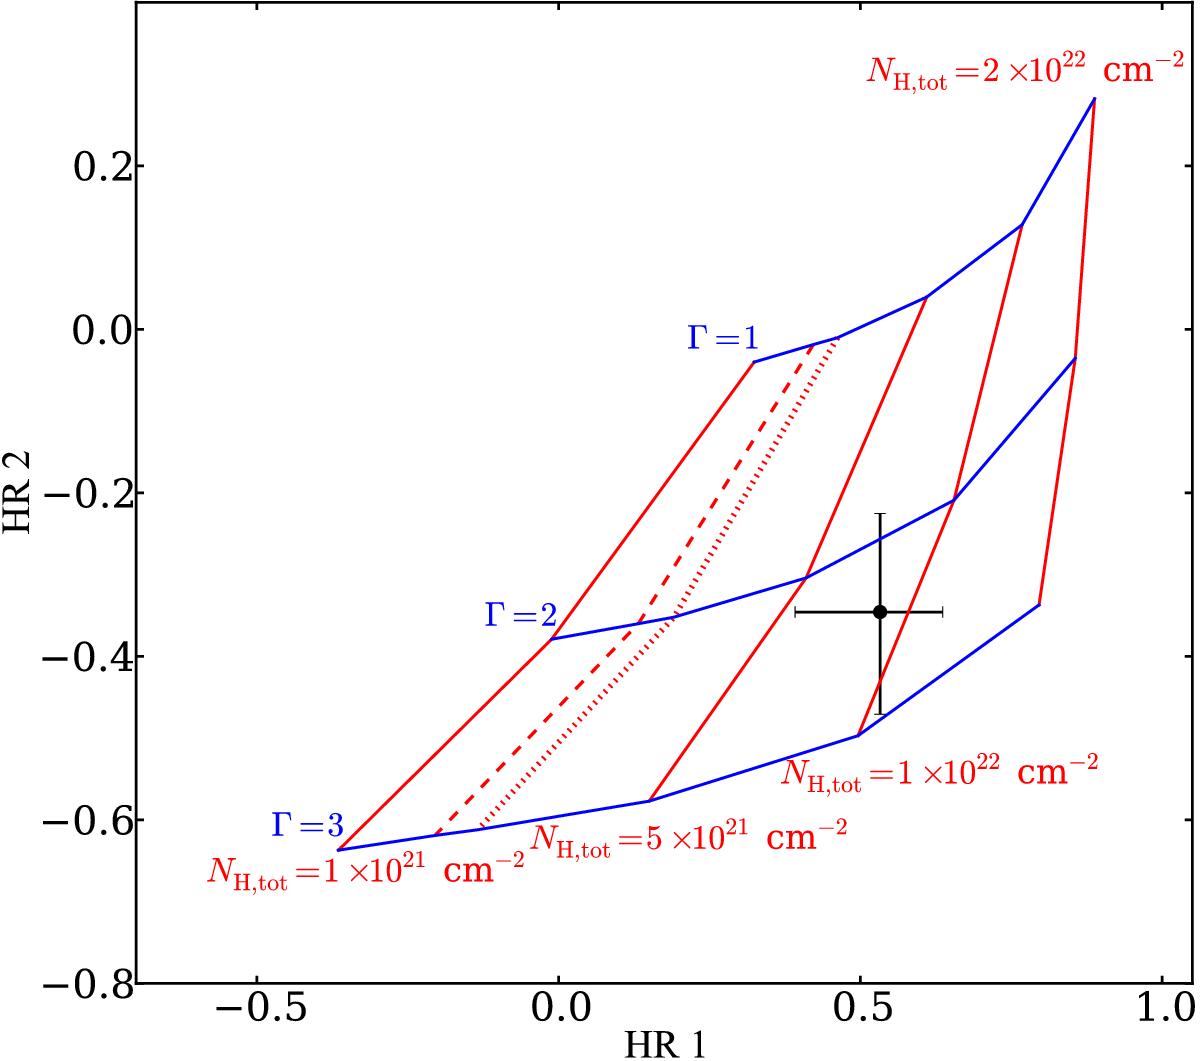
HR plot derived from a grid of simulated spectra, assuming an absorbed power law model, with the HR of XMMU J053348.2−720233 shown in black. See text for a description of the HR simulation and chosen energy bands. The blue lines indicate models on the grid of equal Γ, whereas the red lines mark the models on the grid of equal equivalent hydrogen column NH,tot = NH,Gal + NH,LMC. The dashed red line gives the total NH measured value through the Galaxy and the LMC (Kalberla et al. 2005) of 2 × 1021 cm-2. The dotted red line gives the combined NH measured through the Galaxy and the LMC determined by Dickey & Lockman (1990) and Kim et al. (2003), respectively, of 2.5 × 1021 cm-2.
Current usage metrics show cumulative count of Article Views (full-text article views including HTML views, PDF and ePub downloads, according to the available data) and Abstracts Views on Vision4Press platform.
Data correspond to usage on the plateform after 2015. The current usage metrics is available 48-96 hours after online publication and is updated daily on week days.
Initial download of the metrics may take a while.