Fig. 2
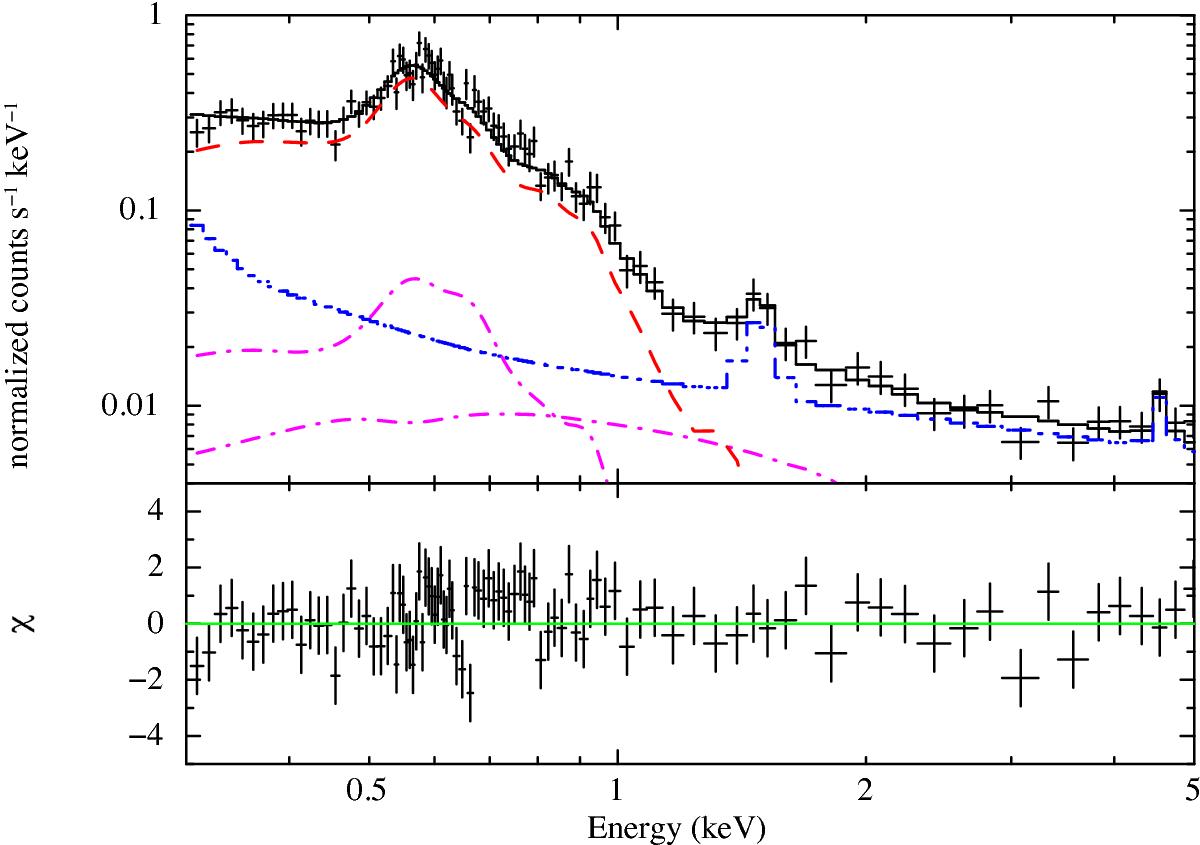
XMM-Newton EPIC-pn spectrum of SNR J0533−7202, shown alone for clarity. The best-fit model is given by the solid black line. The red dashed line indicates the vsedov component corresponding to the SNR emission, the magenta dash-dot lines mark the AXB components, the blue dash-dot-dot-dot line shows the combined contributions of the QPB, residual SPs, instrumental fluorescence lines, and electronic noise. The source fit parameters are given in Table 1.
Current usage metrics show cumulative count of Article Views (full-text article views including HTML views, PDF and ePub downloads, according to the available data) and Abstracts Views on Vision4Press platform.
Data correspond to usage on the plateform after 2015. The current usage metrics is available 48-96 hours after online publication and is updated daily on week days.
Initial download of the metrics may take a while.