Fig. 9
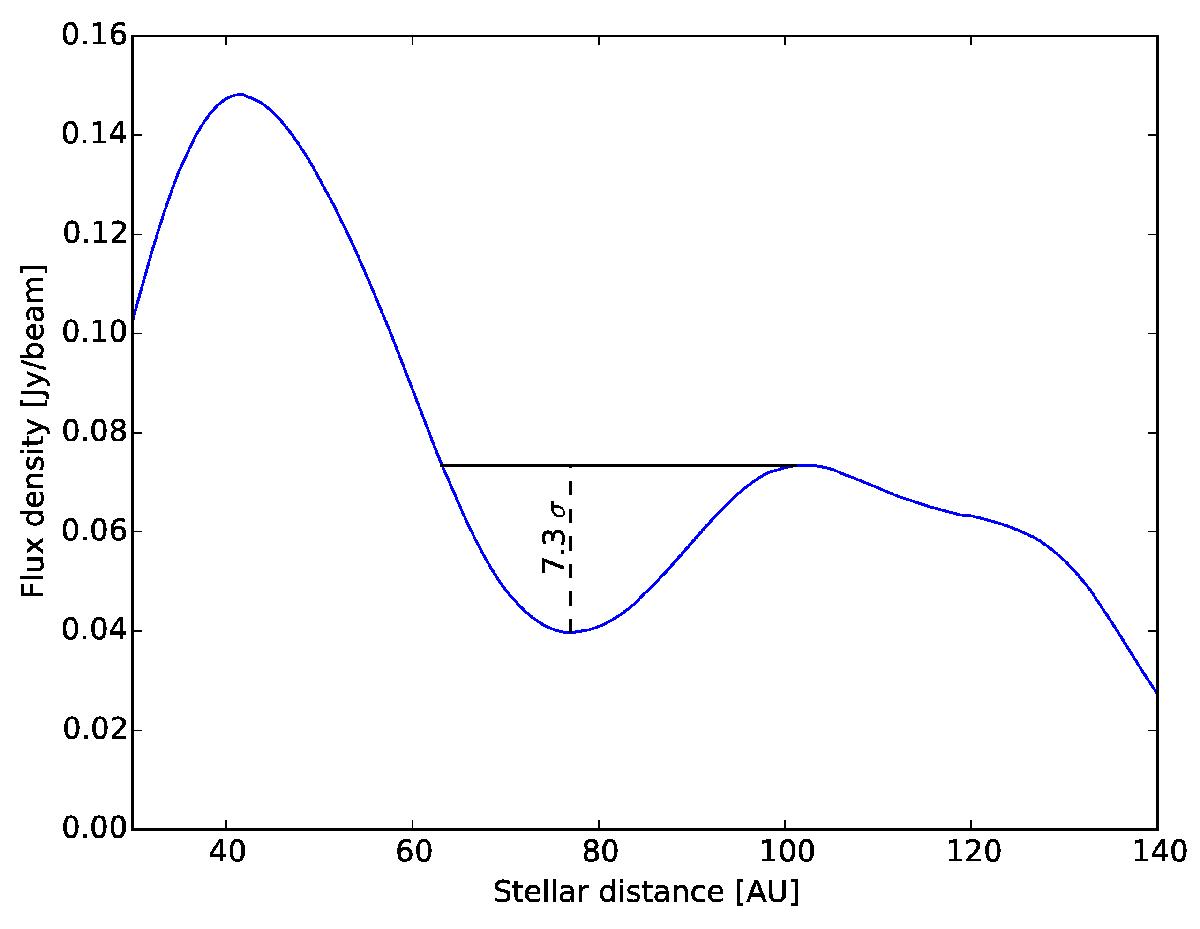
Illustration of the method of detecting gaps. The blue line indicates a radial cut through the HCO+ (4−3) velocity-channel map (Fig. 14) at the central frequency (v = 0.0 m/s). For the simulated ALMA observations, the gap is considered as being detected if the depth of the gap is deeper than three times the noise level σ of the selected transition. In this particular case, the gap is clearly detectable, resulting in a gap contrast of ~7σ.
Current usage metrics show cumulative count of Article Views (full-text article views including HTML views, PDF and ePub downloads, according to the available data) and Abstracts Views on Vision4Press platform.
Data correspond to usage on the plateform after 2015. The current usage metrics is available 48-96 hours after online publication and is updated daily on week days.
Initial download of the metrics may take a while.