Fig. 16
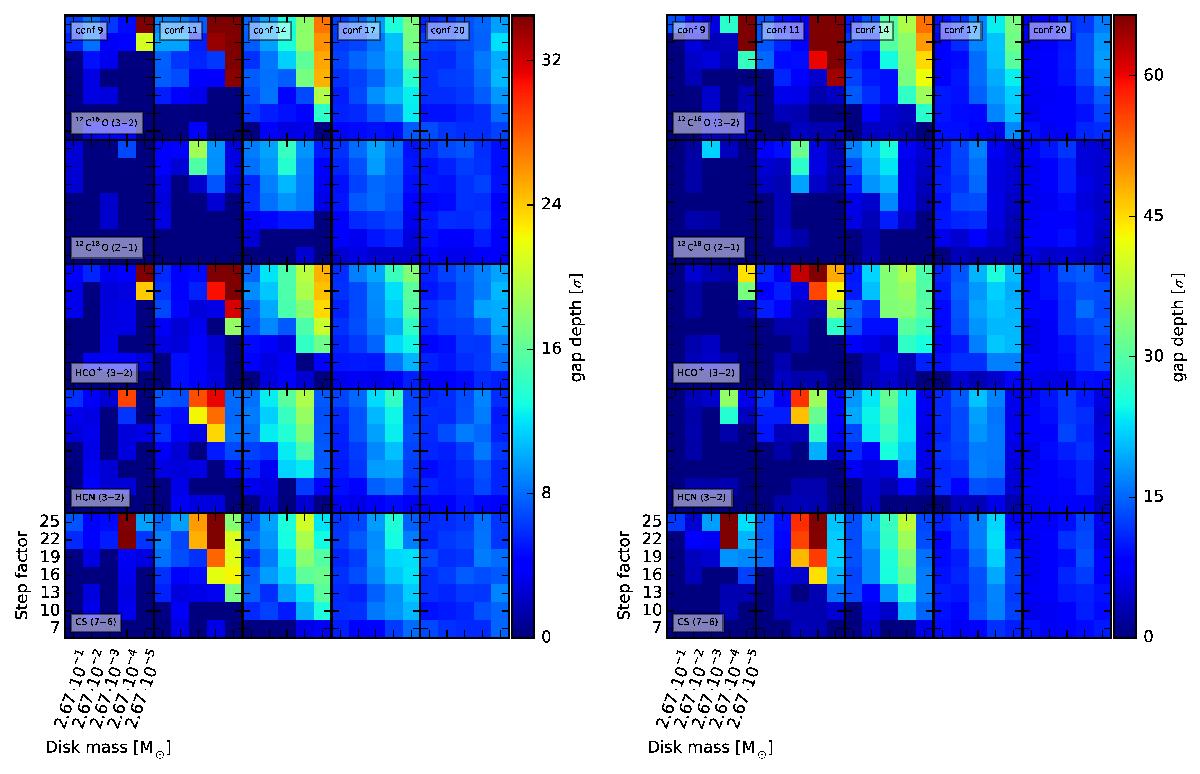
Overview maps of the detectability of gaps around Herbig Ae (left) and T Tauri (right) stars. Each column represents one ALMA configuration and each row represents one molecule transition. The x-axis of the inner plot gives the total mass of the disk, and on the y-axis the scaling factor k is linearly connected to the spatial dimension of the disks. The depth of the gap is color coded in units of σ. We only consider a gap as detected when the depth is at least three times the background noise σ. For both stars, gap detection is feasible for a wide range of models in our setup within three hours of observation. The difference between the two stars is mostly due to the much higher luminosity. Similar to the results in the ideal case, gap detection is feasible but is restricted to low-mass disks (Mdisk ≤ 10-3). Gap detection using the most extent configuration (max. baseline ~16 km) is not feasible within three hours of observation, which is mostly due to the small bandwidth of 50 m/s and is not shown in this overview plot.
Current usage metrics show cumulative count of Article Views (full-text article views including HTML views, PDF and ePub downloads, according to the available data) and Abstracts Views on Vision4Press platform.
Data correspond to usage on the plateform after 2015. The current usage metrics is available 48-96 hours after online publication and is updated daily on week days.
Initial download of the metrics may take a while.