Free Access
Fig. 3
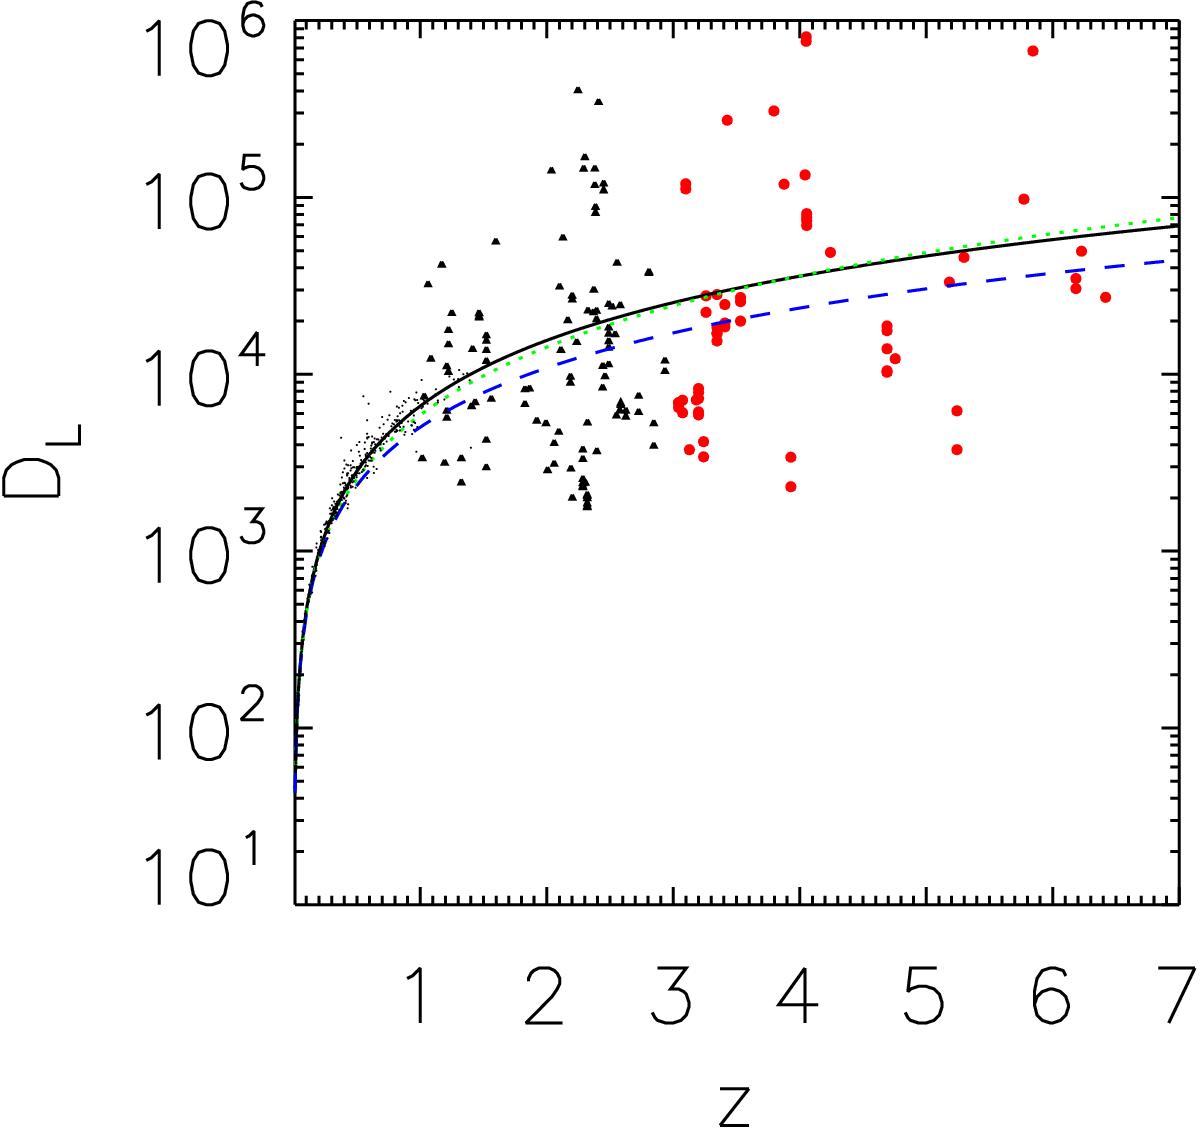
Luminosity distance in Mpc against z. The red circles and black triangles are our CO samples separated at z = 3. The black dots are 192 supernovae used to calibrate our low-z sample. The black solid, green dotted, and blue-dashed lines are (ΩM,ΩΛ) = (0.3,0.7), (0.3, 0.0), and (1.0, 0.0), respectively.
Current usage metrics show cumulative count of Article Views (full-text article views including HTML views, PDF and ePub downloads, according to the available data) and Abstracts Views on Vision4Press platform.
Data correspond to usage on the plateform after 2015. The current usage metrics is available 48-96 hours after online publication and is updated daily on week days.
Initial download of the metrics may take a while.