Free Access
Fig. 2
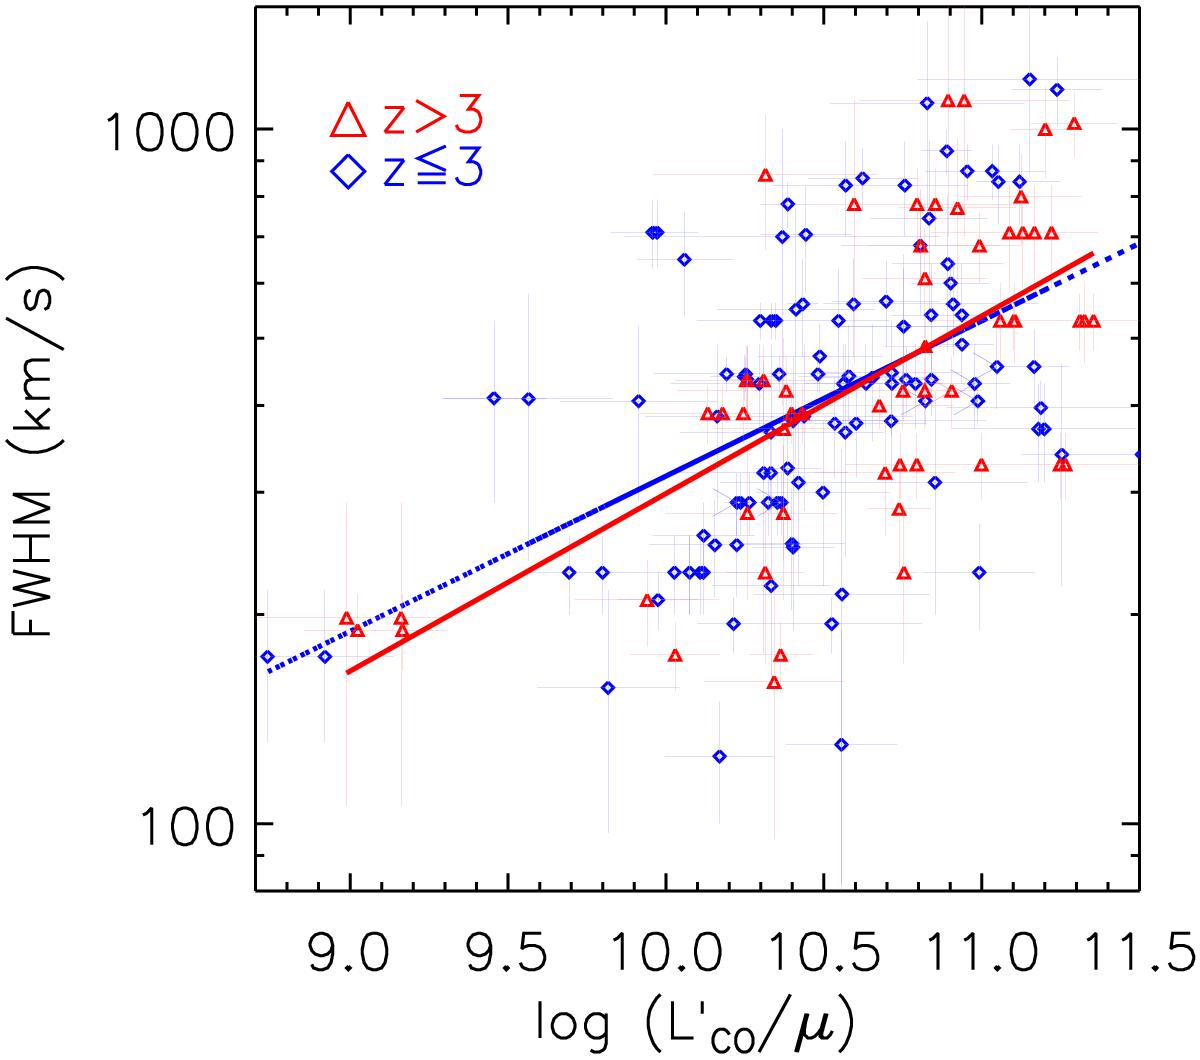
![]() plotted against FWHM. We separated the sample into z> 3 (red triangles) and z ≤ 3 (blue diamonds). The best-fit power laws for the two samples are FWHM (km s-1)
plotted against FWHM. We separated the sample into z> 3 (red triangles) and z ≤ 3 (blue diamonds). The best-fit power laws for the two samples are FWHM (km s-1) ![]() (z ≤ 3, blue) and FWHM (km s-1)
(z ≤ 3, blue) and FWHM (km s-1) ![]() (z> 3, red). The slopes are consistent with each other and with the slope derived from the full sample in Fig. 1.
(z> 3, red). The slopes are consistent with each other and with the slope derived from the full sample in Fig. 1.
Current usage metrics show cumulative count of Article Views (full-text article views including HTML views, PDF and ePub downloads, according to the available data) and Abstracts Views on Vision4Press platform.
Data correspond to usage on the plateform after 2015. The current usage metrics is available 48-96 hours after online publication and is updated daily on week days.
Initial download of the metrics may take a while.