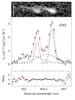
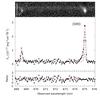
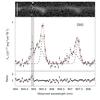
Fig. 2
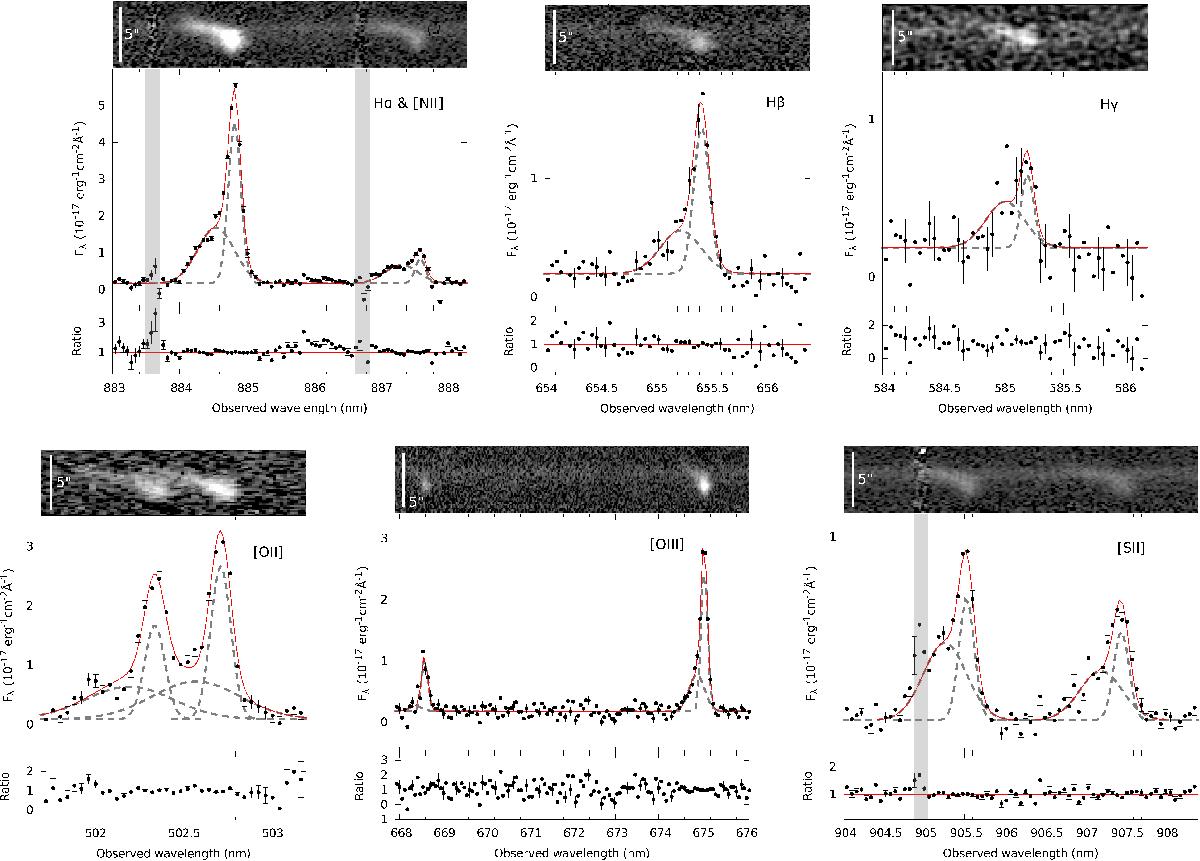
Balmer and forbidden emission lines from the host galaxy of GRB 130925A. In each figure, the top and middle panels show the X-Shooter 2D and 1D spectra zoomed into the wavelength range of the line labelled in the top right corner of the middle panel. The bottom panel shows the residuals from our two-component fits to the 1D spectrum. In the middle panel, we also show the best-fit Gaussians for each individual component (dashed grey lines) and composite model (red solid line).
Current usage metrics show cumulative count of Article Views (full-text article views including HTML views, PDF and ePub downloads, according to the available data) and Abstracts Views on Vision4Press platform.
Data correspond to usage on the plateform after 2015. The current usage metrics is available 48-96 hours after online publication and is updated daily on week days.
Initial download of the metrics may take a while.