Fig. 5
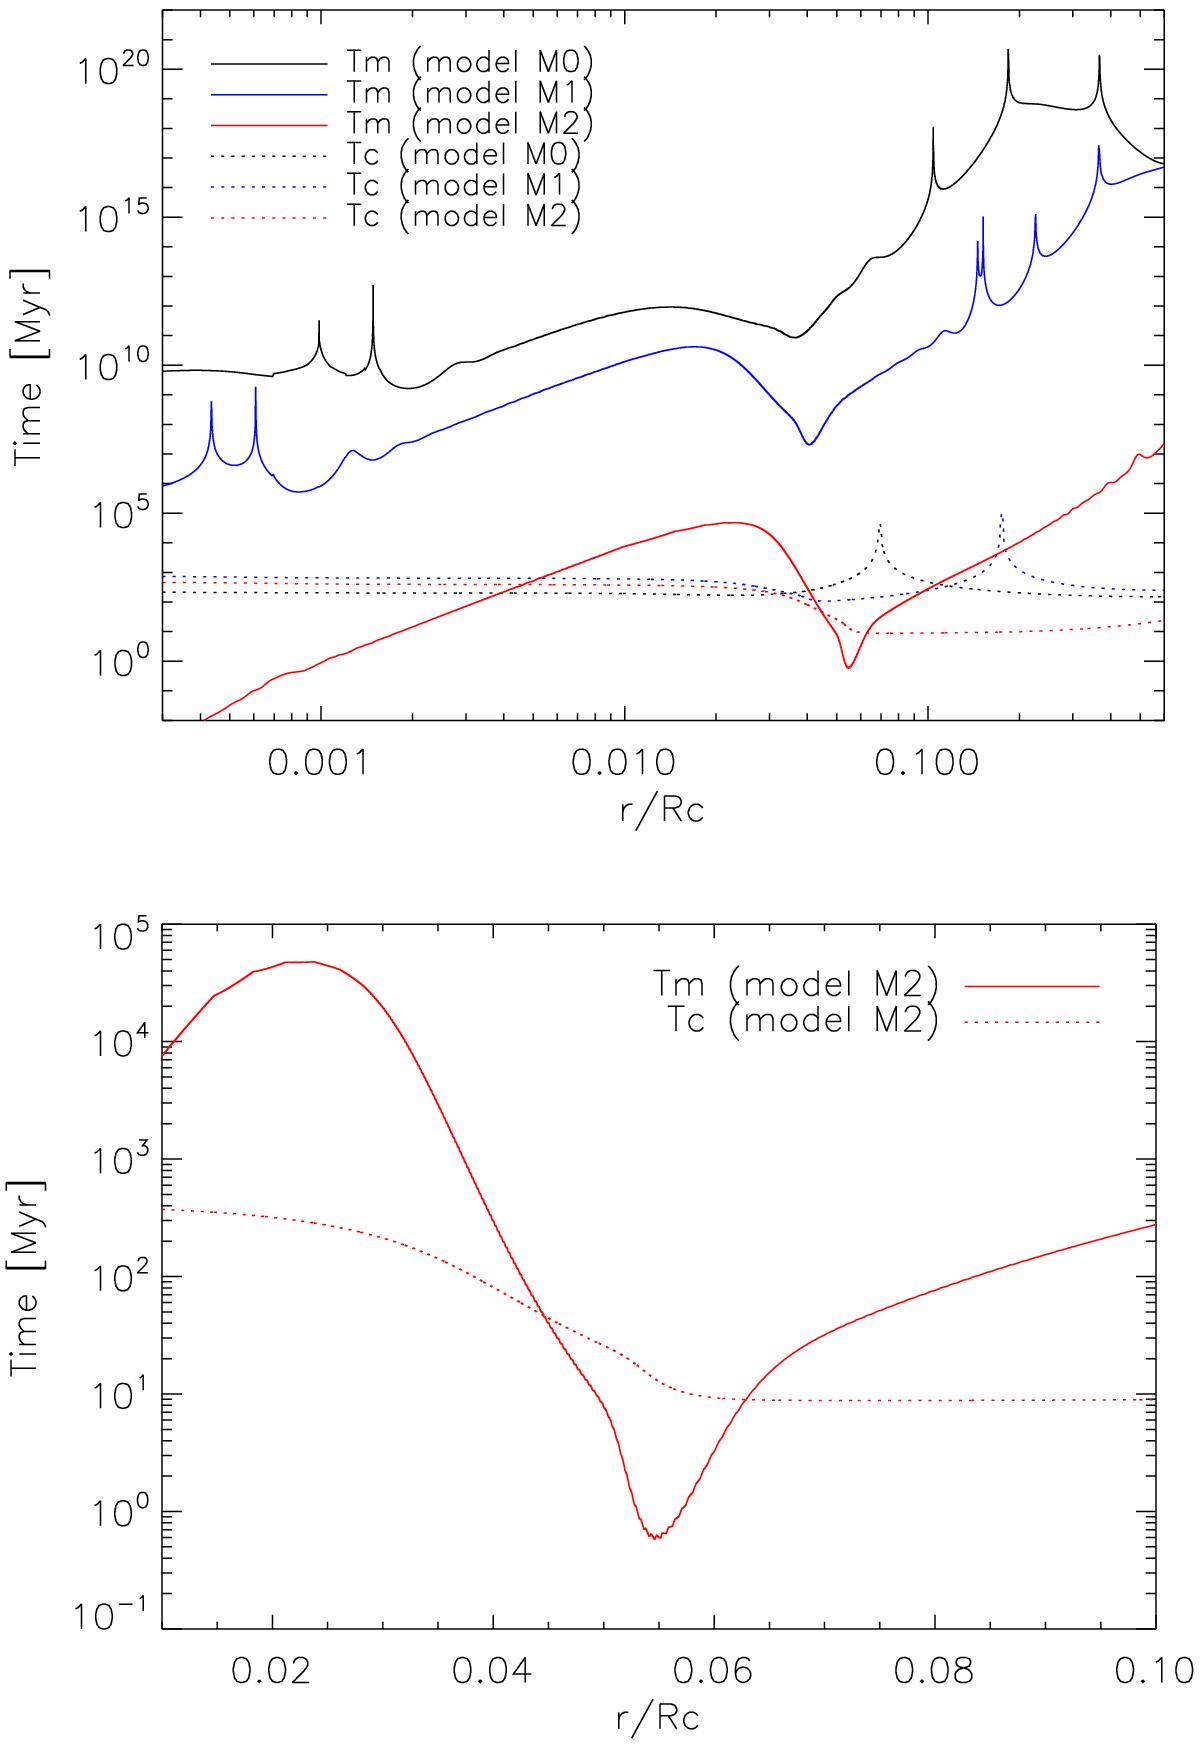
Top panel: timescales versus normalised radius (i.e., normalised by the radius of the base of the convective envelope) for models M0, M1, and M2. The solid lines correspond to the timescale associated with the transport of angular momentum by mixed modes (see Eq. (18)) and the dotted lines correspond to the timescale associated with the contraction of the star (see Eq. (19)). Bottom panel: same as the top panel, except that only a zoom for model M2 is shown.
Current usage metrics show cumulative count of Article Views (full-text article views including HTML views, PDF and ePub downloads, according to the available data) and Abstracts Views on Vision4Press platform.
Data correspond to usage on the plateform after 2015. The current usage metrics is available 48-96 hours after online publication and is updated daily on week days.
Initial download of the metrics may take a while.