Fig. 2
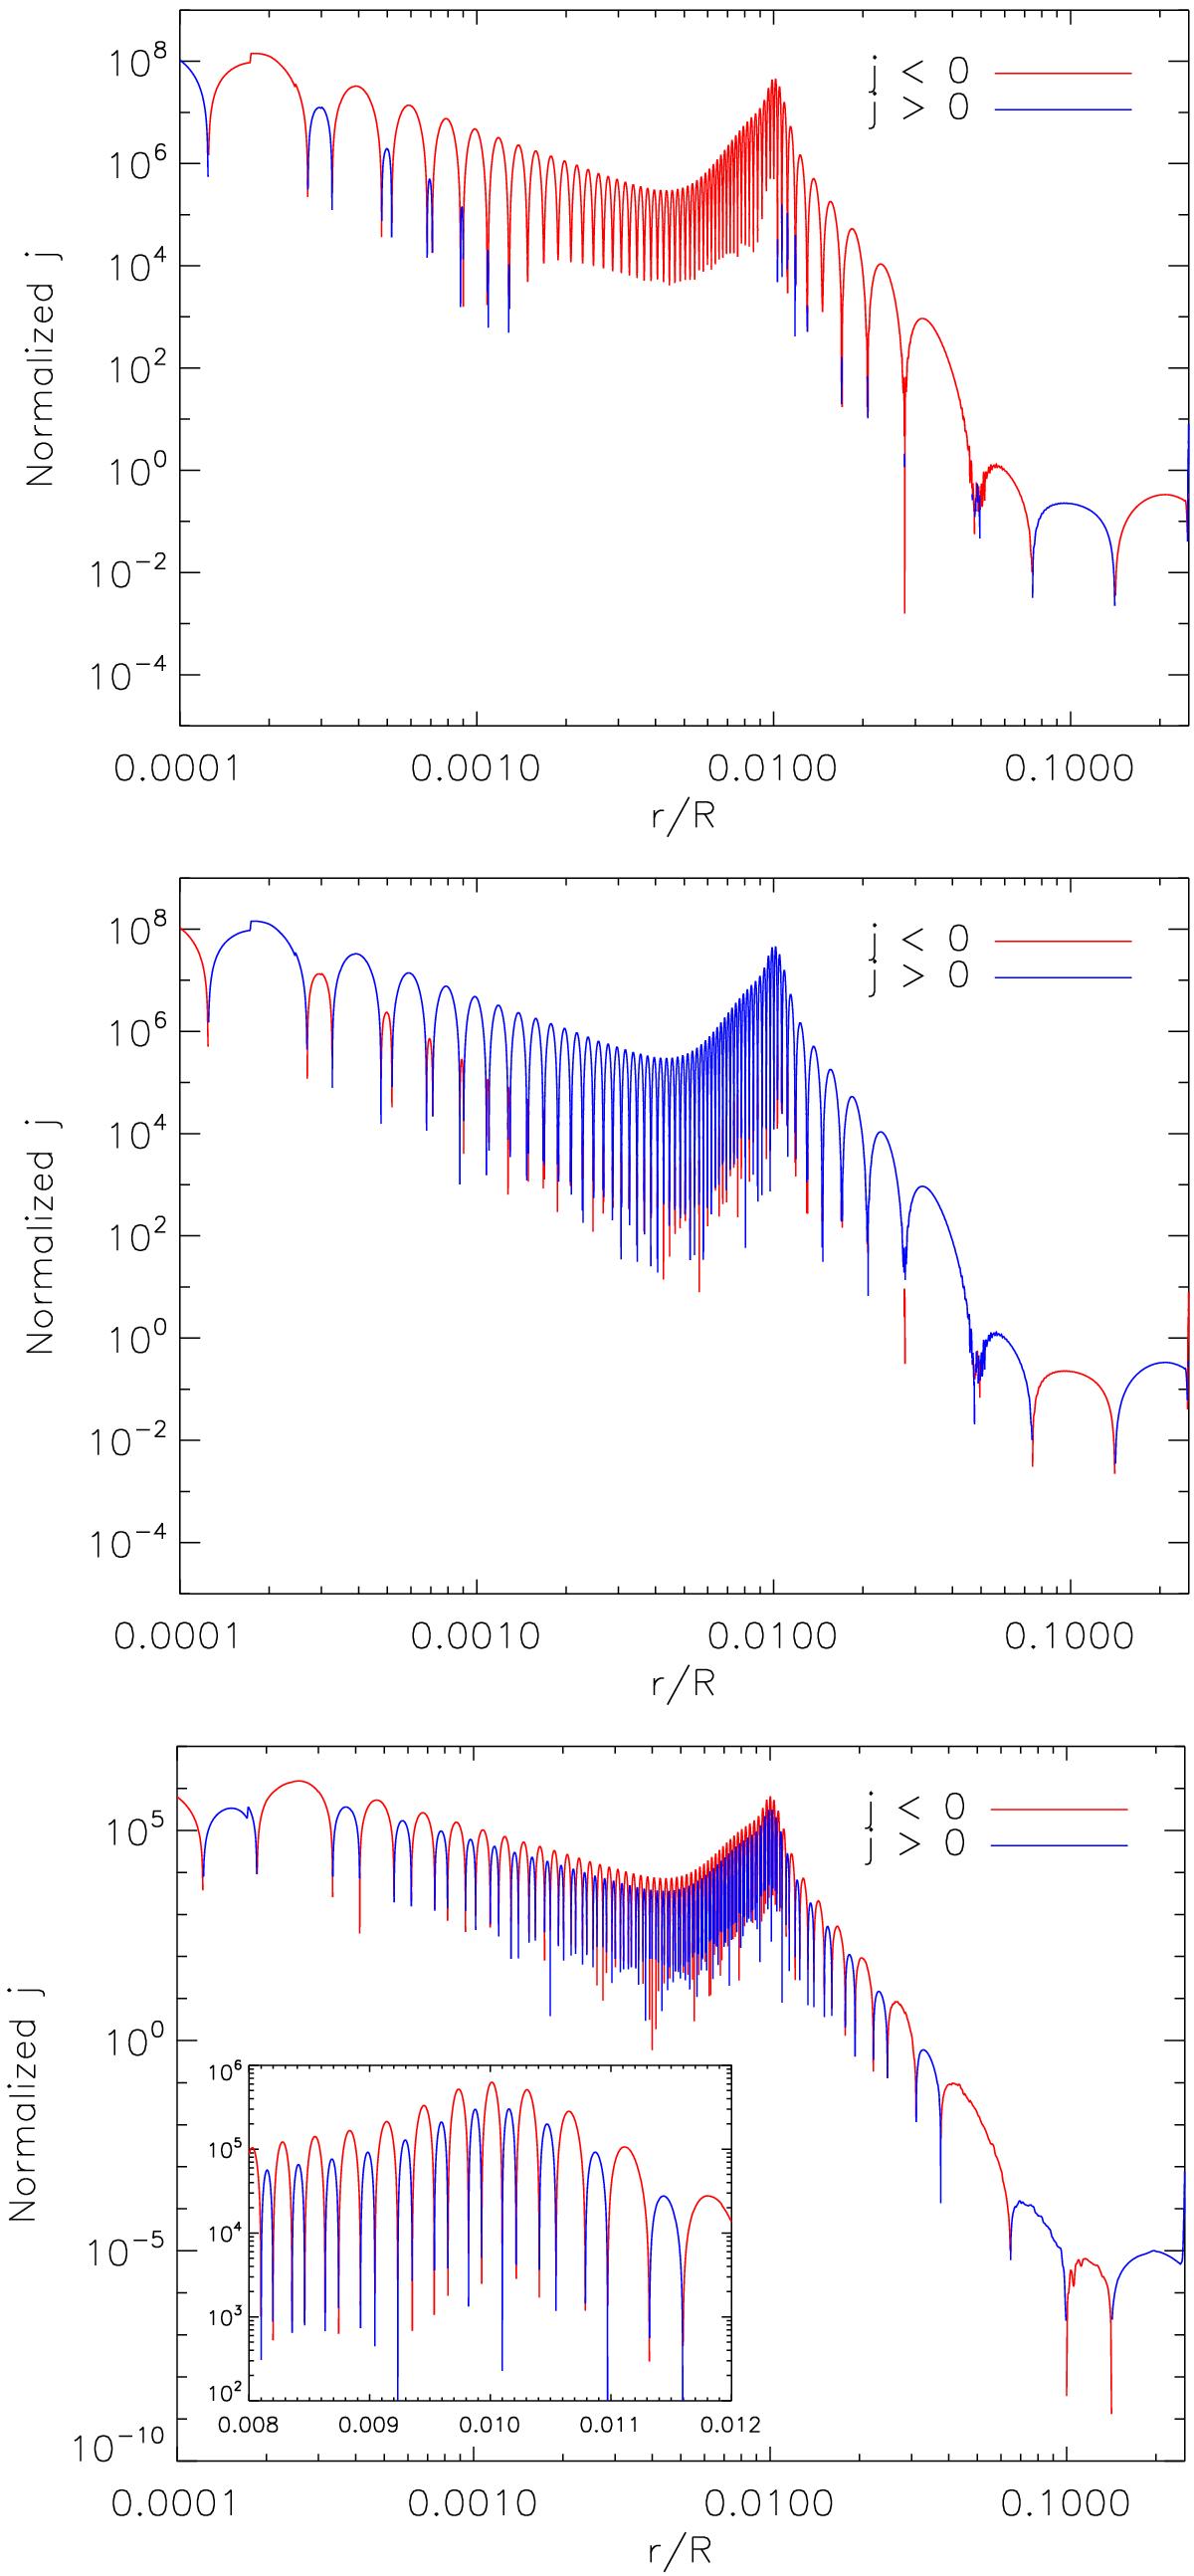
Rate of angular momentum transport by mixed modes (![]() as defined by Eq. (59)) computed as described in Sect. 4.2 for the 1.3 M⊙ model described in Sect. 5.1 versus the radius normalised by the radius of the radiative region.
as defined by Eq. (59)) computed as described in Sect. 4.2 for the 1.3 M⊙ model described in Sect. 5.1 versus the radius normalised by the radius of the radiative region. ![]() is normalised so that
is normalised so that ![]() at the photosphere. The colour code is as follows: the solid red line corresponds to
at the photosphere. The colour code is as follows: the solid red line corresponds to ![]() (thus to a spin down) and the solid blue line to
(thus to a spin down) and the solid blue line to ![]() (thus to a spin up). The top panel exhibits the result for the prograde mode ℓ = −m = 2 of frequency νR = 300,9 μHz, the middle panel corresponds to the retrograde mode ℓ = m = 2, and the bottom panel to summation of
(thus to a spin up). The top panel exhibits the result for the prograde mode ℓ = −m = 2 of frequency νR = 300,9 μHz, the middle panel corresponds to the retrograde mode ℓ = m = 2, and the bottom panel to summation of ![]() for the prograde and retrograde modes. We only show the inner radiative region, for which our formalism is valid.
for the prograde and retrograde modes. We only show the inner radiative region, for which our formalism is valid.
Current usage metrics show cumulative count of Article Views (full-text article views including HTML views, PDF and ePub downloads, according to the available data) and Abstracts Views on Vision4Press platform.
Data correspond to usage on the plateform after 2015. The current usage metrics is available 48-96 hours after online publication and is updated daily on week days.
Initial download of the metrics may take a while.