Free Access
Fig. 2
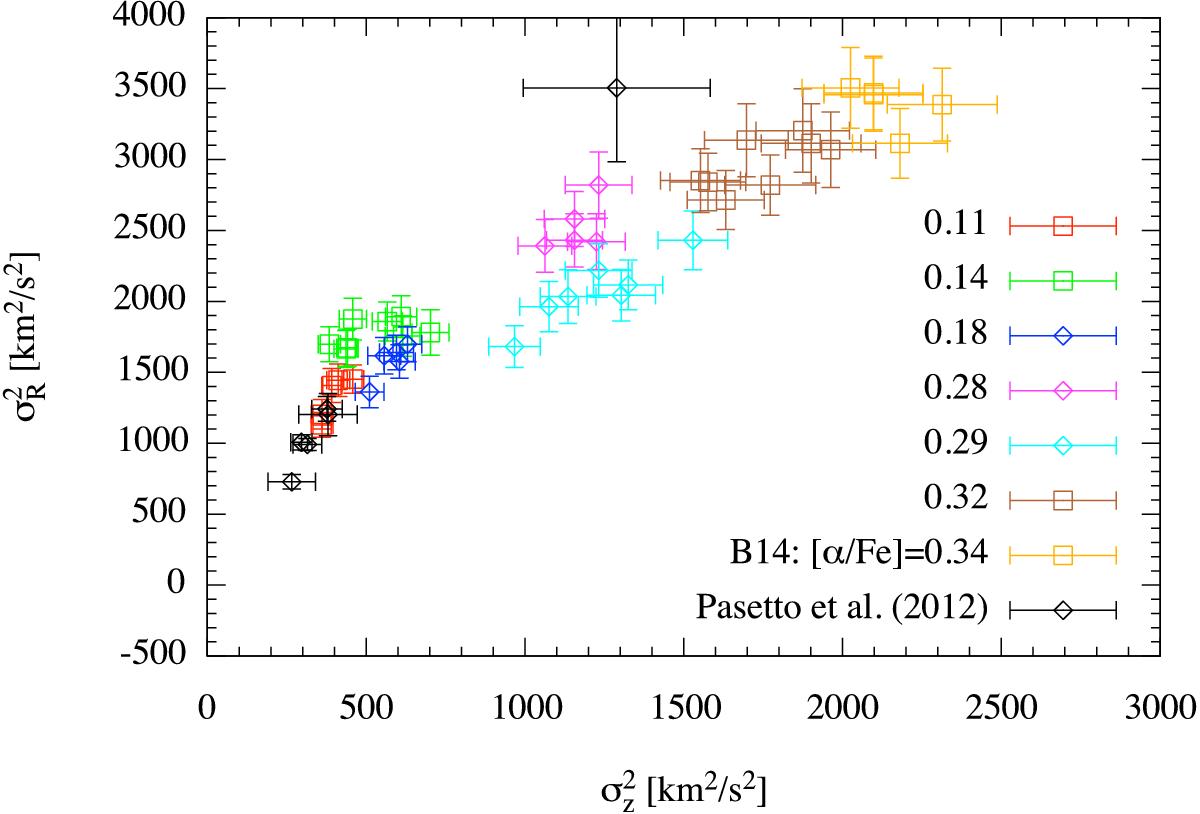
![]() and
and ![]() data from Büdenbender et al. (2014; B14) and Pasetto et al. (2012a,b); for the B14 SEGUE data, each colour represents a different [Fe/H] and [α/Fe] mono-abundance tracer population (and was chosen to reproduce the corresponding plots in B14), whereas the Pasetto et al. data are for undifferentiated RAVE stars.
data from Büdenbender et al. (2014; B14) and Pasetto et al. (2012a,b); for the B14 SEGUE data, each colour represents a different [Fe/H] and [α/Fe] mono-abundance tracer population (and was chosen to reproduce the corresponding plots in B14), whereas the Pasetto et al. data are for undifferentiated RAVE stars.
Current usage metrics show cumulative count of Article Views (full-text article views including HTML views, PDF and ePub downloads, according to the available data) and Abstracts Views on Vision4Press platform.
Data correspond to usage on the plateform after 2015. The current usage metrics is available 48-96 hours after online publication and is updated daily on week days.
Initial download of the metrics may take a while.