Free Access
Fig. 9
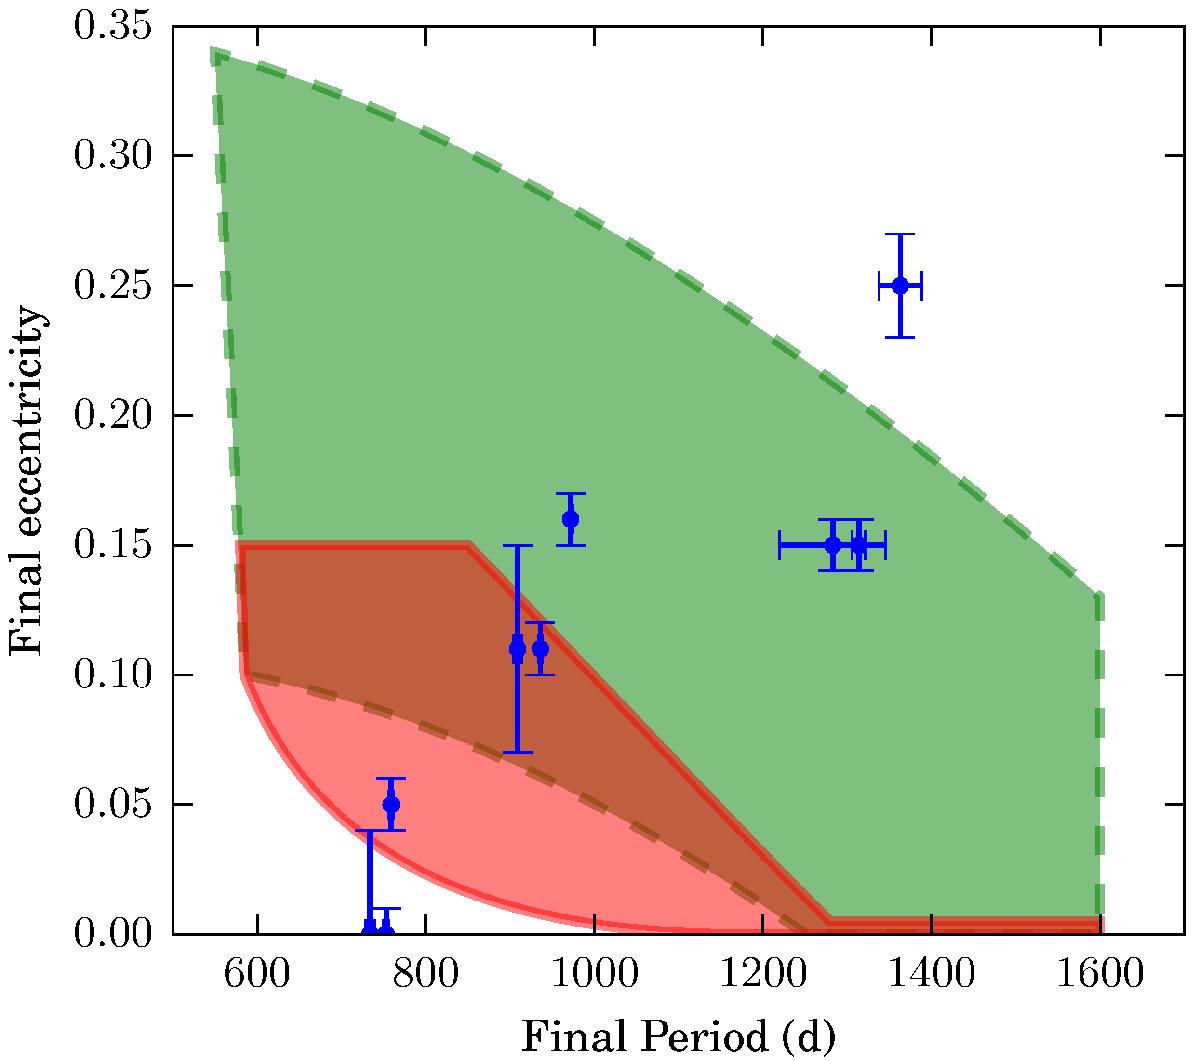
Approximate region of the period-eccentricity diagram that can be explained by the RLOF models (red shaded region with solid border) and models containing a CB disk (green shaded region with dashed border). The observed systems are plotted in blue dots.
Current usage metrics show cumulative count of Article Views (full-text article views including HTML views, PDF and ePub downloads, according to the available data) and Abstracts Views on Vision4Press platform.
Data correspond to usage on the plateform after 2015. The current usage metrics is available 48-96 hours after online publication and is updated daily on week days.
Initial download of the metrics may take a while.