Fig. 5
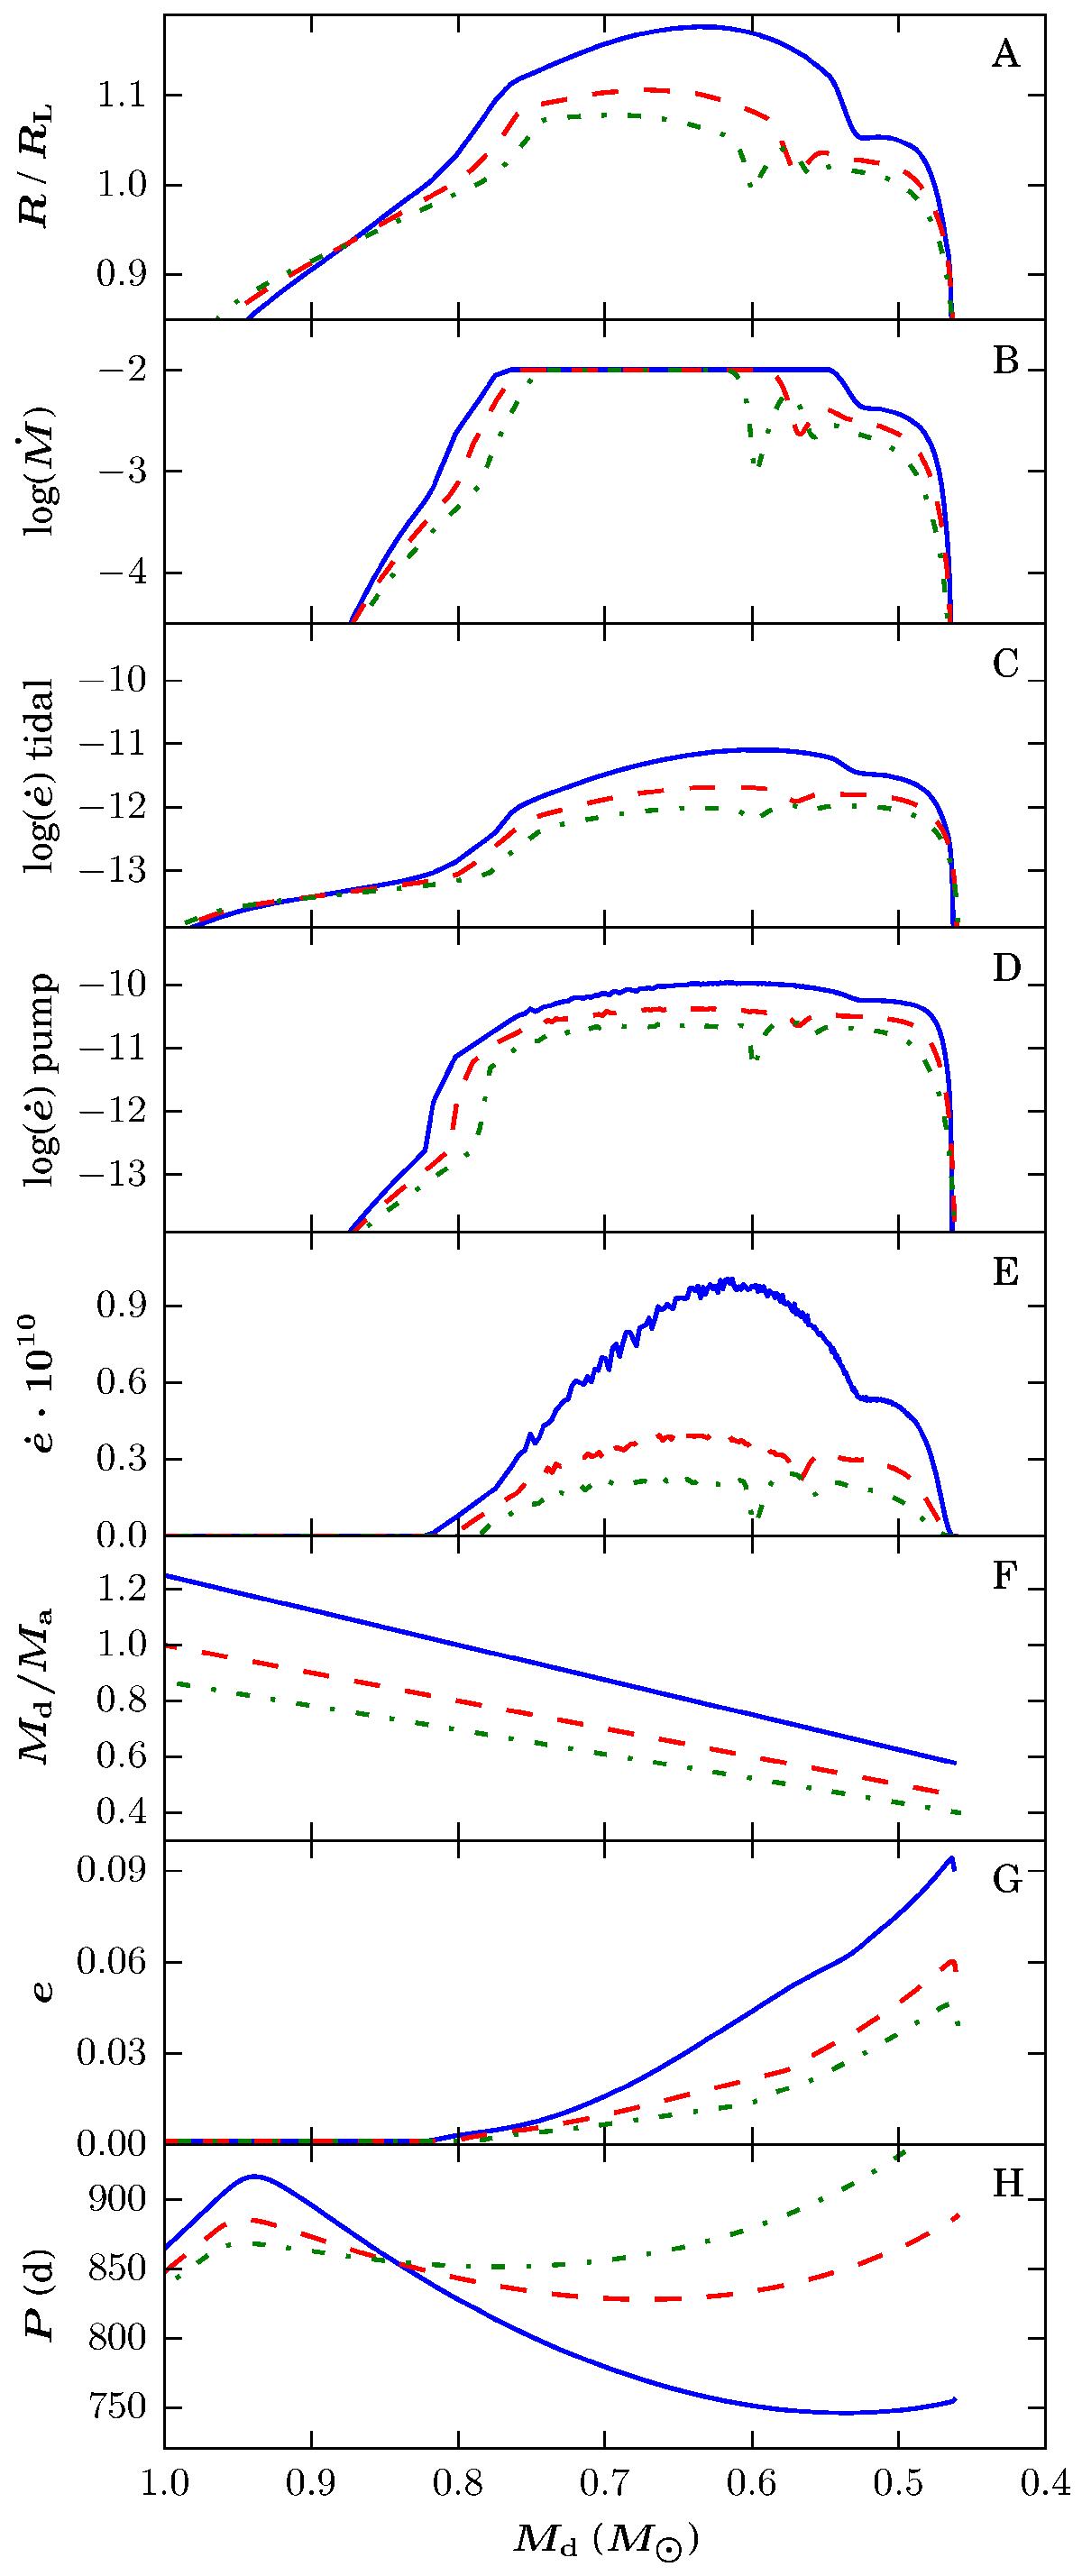
Comparison of three models with different values for the companion mass: 0.8 M⊙ (solid blue), 1.0 M⊙ (dashed red) and 1.15 M⊙ (dot-dashed green). Panel A) the Roche-lobe overfilling factor. Panel B) the mass loss rate during RLOF in M⊙ yr-1. Panel C) the tidal forces in log(s-1). Panel D) the eccentricity pumping forces in log(s-1). Panel E) net change in eccentricity per second. Panel F) mass ratio. Panel G) the eccentricity. Panel H) the orbital period in days. See Sect. 6 for discussion.
Current usage metrics show cumulative count of Article Views (full-text article views including HTML views, PDF and ePub downloads, according to the available data) and Abstracts Views on Vision4Press platform.
Data correspond to usage on the plateform after 2015. The current usage metrics is available 48-96 hours after online publication and is updated daily on week days.
Initial download of the metrics may take a while.