Fig. 4
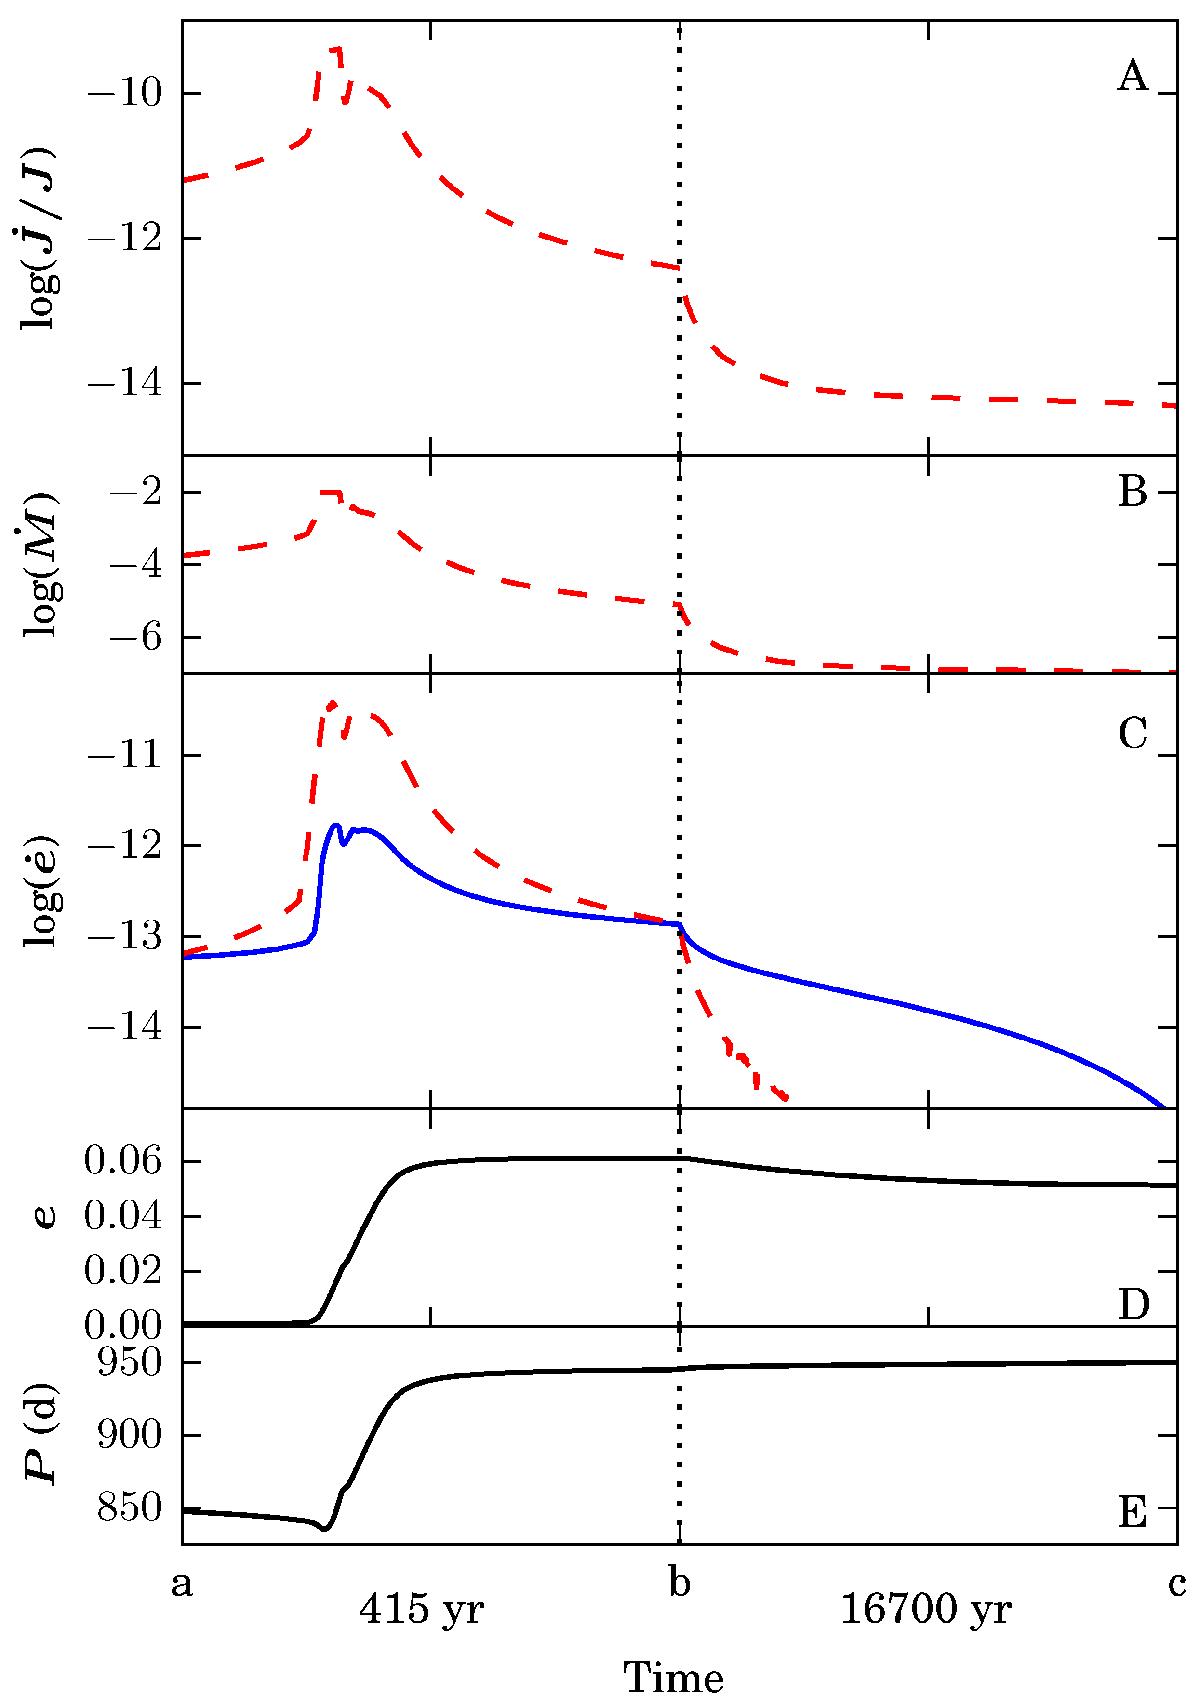
Time evolution of several binary properties during the RLOF phase. Three different events are indicated on the X-axes, a: ėml>ėtidal, b: ėml<ėtidal and c: log (ėtidal) < − 15. The time scale differs between the phases, but is linear withing each phase. The duration of each phase is shown under the figure. Panel A) the change in angular momentum. Panel B) mass loss through RLOF. Panel C) the tidal forces (blue) and eccentricity pumping due to mass loss (red). Panel D) the orbital eccentricity. Panel E) the orbital period. See Sect. 6.2.1 for discussion.
Current usage metrics show cumulative count of Article Views (full-text article views including HTML views, PDF and ePub downloads, according to the available data) and Abstracts Views on Vision4Press platform.
Data correspond to usage on the plateform after 2015. The current usage metrics is available 48-96 hours after online publication and is updated daily on week days.
Initial download of the metrics may take a while.