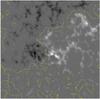
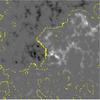
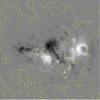
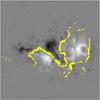
Fig. 2
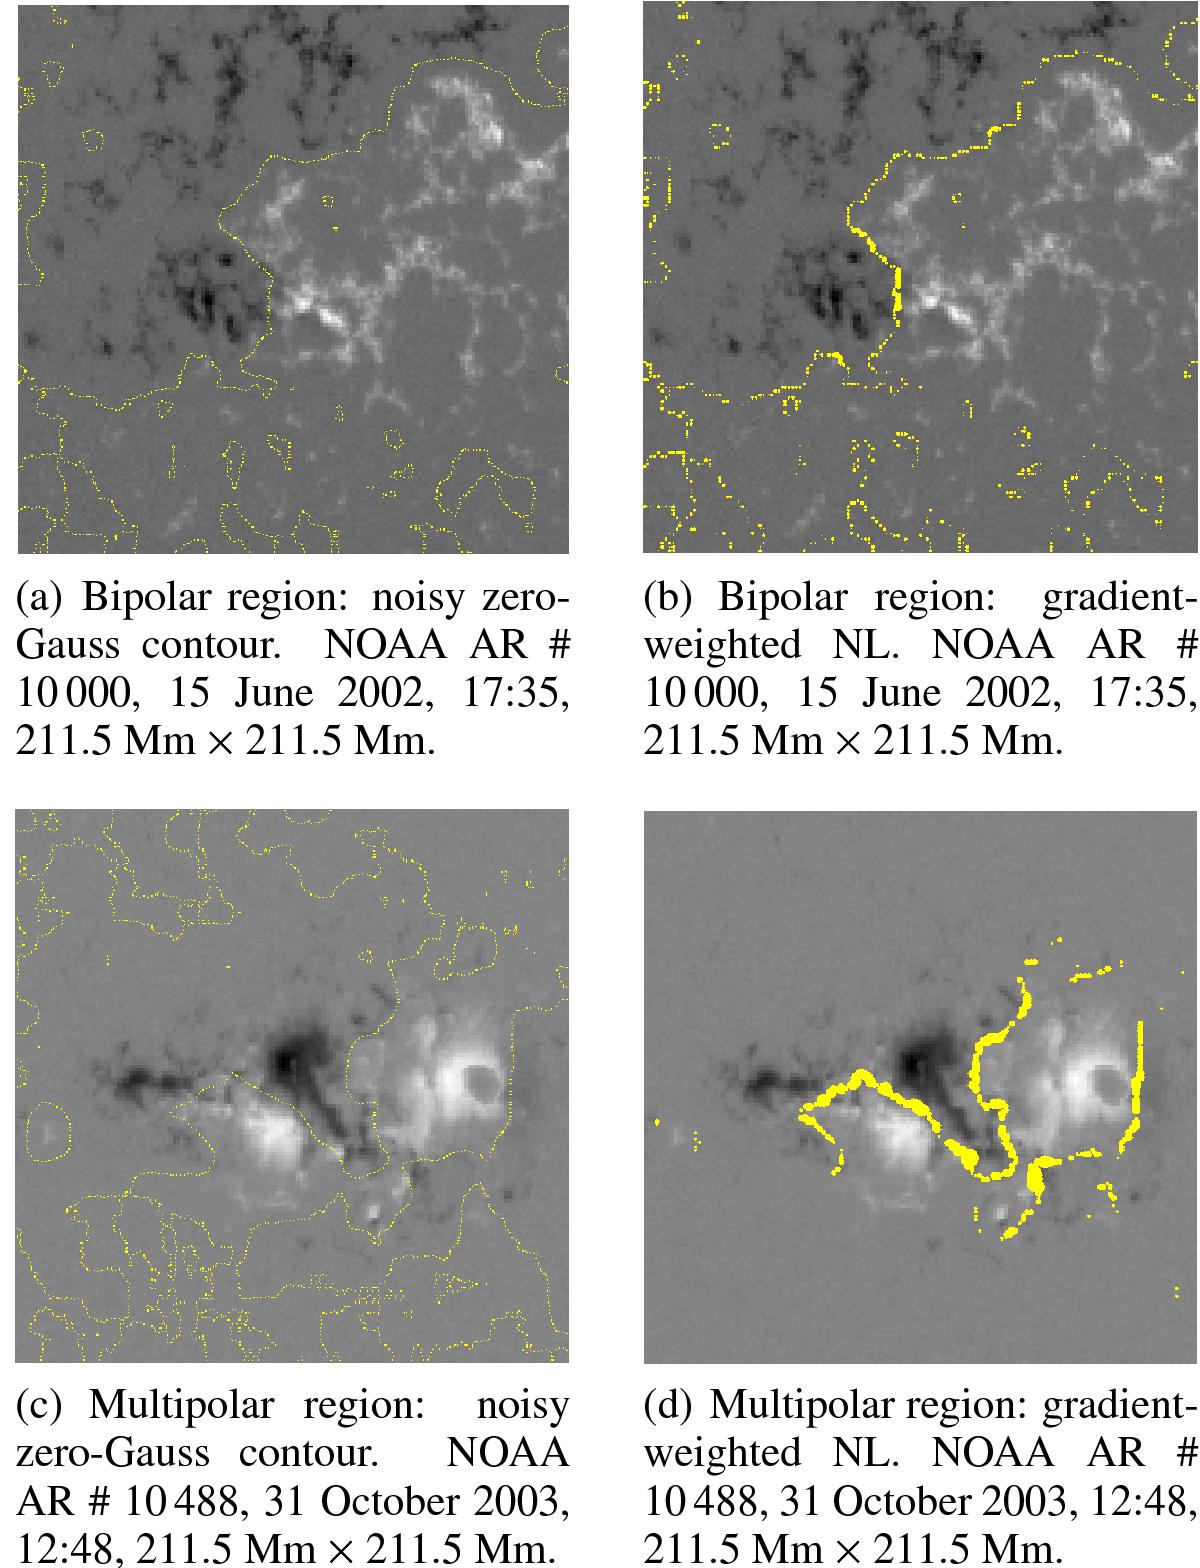
Illustrations of NL analysis. a), c) Noisy zero-Gauss contour before being weighted by the gradient image. We note the presence of zero-Gauss contours throughout the image, not just in the region separating the strong positive and negative flux. b), d) Larger yellow markers indicate the presence of a stronger gradient at that spatial location along the NL.
Current usage metrics show cumulative count of Article Views (full-text article views including HTML views, PDF and ePub downloads, according to the available data) and Abstracts Views on Vision4Press platform.
Data correspond to usage on the plateform after 2015. The current usage metrics is available 48-96 hours after online publication and is updated daily on week days.
Initial download of the metrics may take a while.