Fig. 4
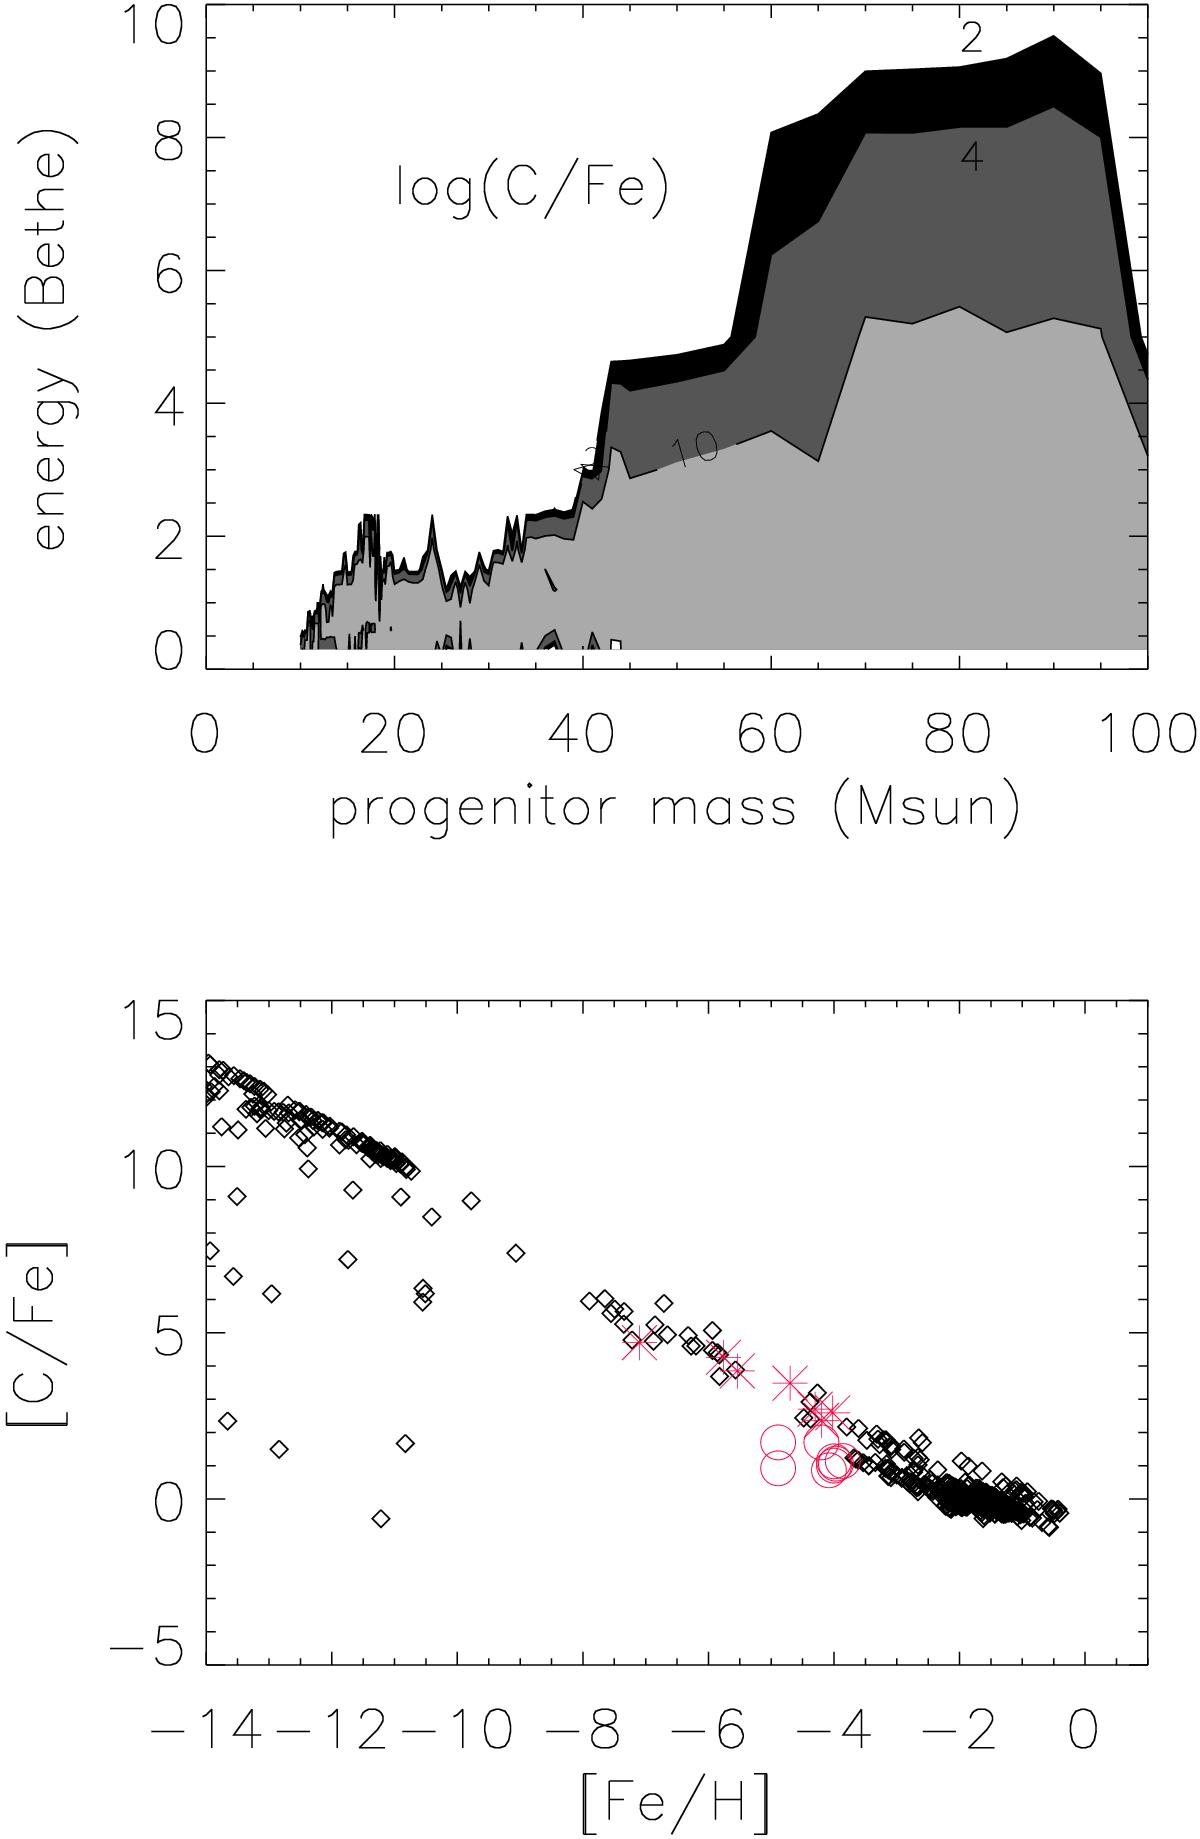
Top panel: contour diagram showing the carbon-to-iron mass ratio, as a function of progenitor mass and explosion energy, predicted for the supernovae yields of zero metallicity stars by Heger & Woosley (2010). Contours are shown for log (C/Fe) = 2,4,10 and 20. Bottom panel: the carbon-to-iron ratio, as a function of iron production, predicted for the supernovae models (rhombi; with iron multiplied by an arbitrary factor), and abundances found in the most iron-poor stars known (the upper limits for iron in SMSSJ031300.36−670839.3 have been ignored for simplicity). The asterisks correspond to stars that have [C/Fe] > + 2, and the open circles show those with lower carbon-to-iron ratios.
Current usage metrics show cumulative count of Article Views (full-text article views including HTML views, PDF and ePub downloads, according to the available data) and Abstracts Views on Vision4Press platform.
Data correspond to usage on the plateform after 2015. The current usage metrics is available 48-96 hours after online publication and is updated daily on week days.
Initial download of the metrics may take a while.