Fig. 1
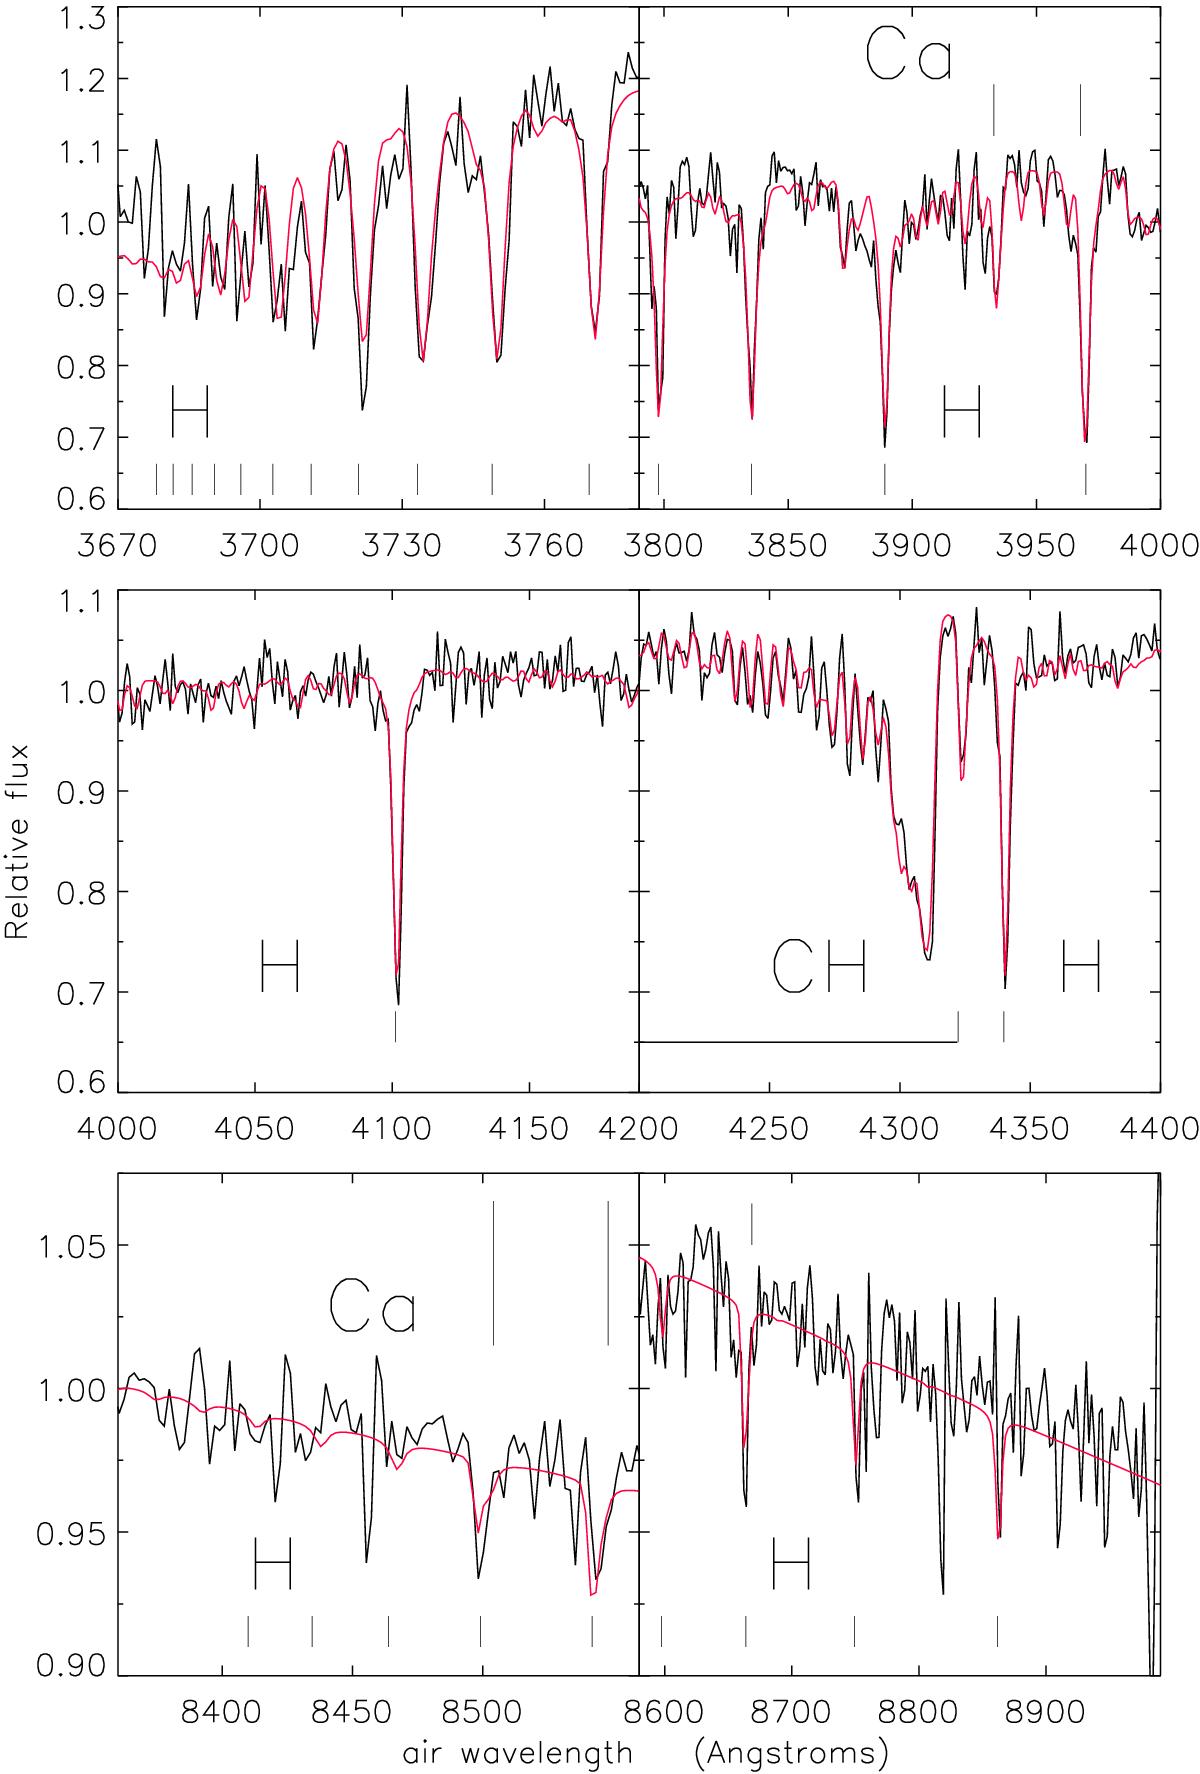
BOSS spectrum of J1313−0019 (black) and best-fitting model (red). The elements or molecules associated with the most prominent lines are identified. The continuum correction has been carried out following the procedure described by Allende Prieto et al. (2014), namely dividing the spectral range in 20 segments and dividing the flux in each by its mean value. This algorithm is very robust to changes in the signal-to-noise ratio, and our own simulations show that has excellent performance.
Current usage metrics show cumulative count of Article Views (full-text article views including HTML views, PDF and ePub downloads, according to the available data) and Abstracts Views on Vision4Press platform.
Data correspond to usage on the plateform after 2015. The current usage metrics is available 48-96 hours after online publication and is updated daily on week days.
Initial download of the metrics may take a while.