Fig. 9
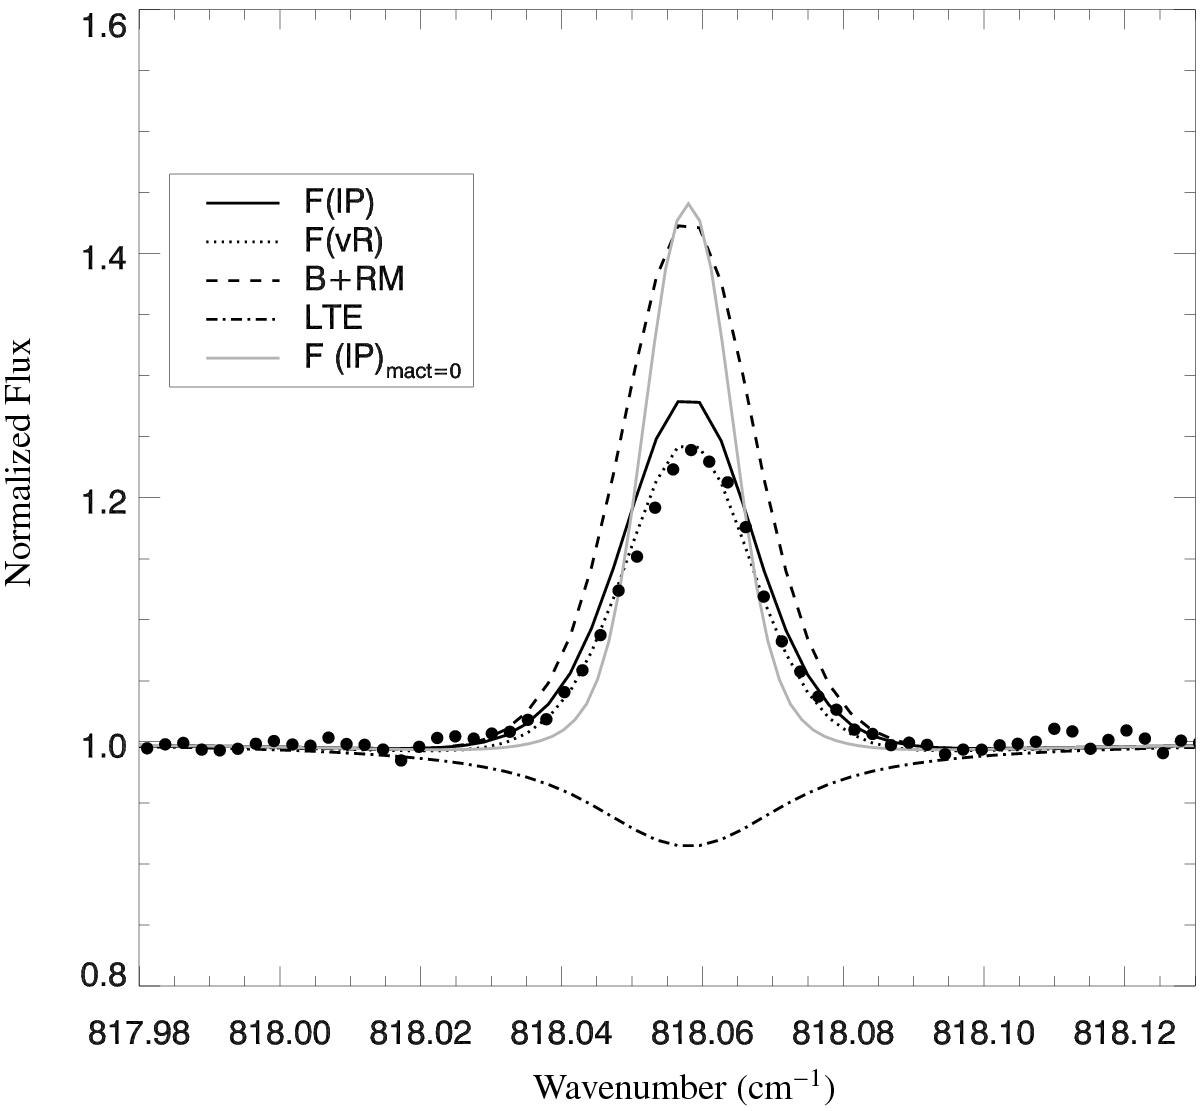
Profile of the 12.2 μm line observed in Arcturus by Sundqvist et al. (black circles) and compared with our calculations using the ⟨ 3D ⟩ 1D atmospheric model and the non-LTE abundance taken from Table 9. The black lines show synthetic profiles using different model atoms (see Table 8), and are all convolved with a macroturbulent velocity of 5.2 km s-1 and a rotational broadening of vsini = 2.1 km s-1. The grey line is the profile using the F model atom but without macroturbulence.
Current usage metrics show cumulative count of Article Views (full-text article views including HTML views, PDF and ePub downloads, according to the available data) and Abstracts Views on Vision4Press platform.
Data correspond to usage on the plateform after 2015. The current usage metrics is available 48-96 hours after online publication and is updated daily on week days.
Initial download of the metrics may take a while.